


We have an investment process that we use to analyze any potential investment idea. The process consists of four quadrants:
- Business. The growth, risks, and competitive advantage of a company’s business model
- Management. How talented and shareholder-friendly is the management team?
- Financials. The financial performance of a company over the last 5-10 years
- Valuation. Is the stock currently undervalued?
Now it can take quite a bit of time to analyze a company across all four quadrants – especially the business and management quadrants. Understanding a company’s business model (along with its myriad moving parts) and evaluating key management behavior requires effort and research. Many times, the information may not be easily available as well.
Financials and valuation on the other hand are done a lot faster. Because these quadrants deal with numbers and hard data, it’s easy to see whether or not a company has been performing over the last few years. Financial numbers and ratios are also objective (to a certain extent) and data is easily available online for the most part.
Because of this, it makes sense to start with financial figures and ratios to analyze a company and screen for potential investment ideas. It’s more efficient to spend 15-30 minutes looking at a company’s financials before deciding whether it’s worth pouring more time into further research. It’s pretty straightforward: If a company’s financials are poor and doesn’t pass our criteria, we bin it and move on to the next one (like a blind date gone bad).
So the question now is which financial metrics and ratios do we use to screen for potential ideas — and weed out the rest? Here are four we use for a start:
- Revenue growth. Is the company growing at a decent growth rate annually the last 3-5 years?
- Net profit margins. The amount of net profit a company keeps from every dollar of revenue. The higher, the better. A net margin of 10% and above is good.
- Return on equity. The amount of net profit a company generates for every dollar of equity. The higher, the better. An ROE of 15% and above is good.
- Debt/equity. The proportion of debt and equity used to finance a company’s assets. The lower the ratio, the less debt a company has. A ratio below 0.5 is ideal.
A quick way to screen for companies that pass these criteria is to use a screener. There are many options out there. Some like ShareInvestor’s Web Pro have pretty comprehensive features but cost around $200 a year. If you prefer a free version, StockFacts by our very own SGX is good too.
Let’s plug in our criteria into SGX StockFacts:
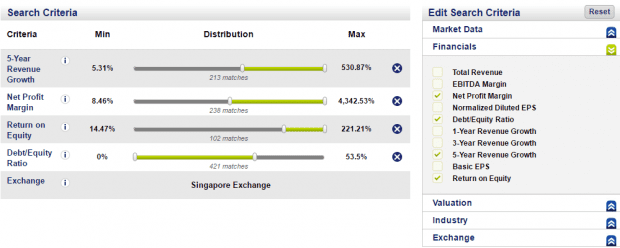
Our inputs are:
- Revenue must be growing at least 5% annually the last five years
- Net profit margin is above 8%
- ROE is above 15%
- Debt/equity ratio is below 0.5
And here are the results…
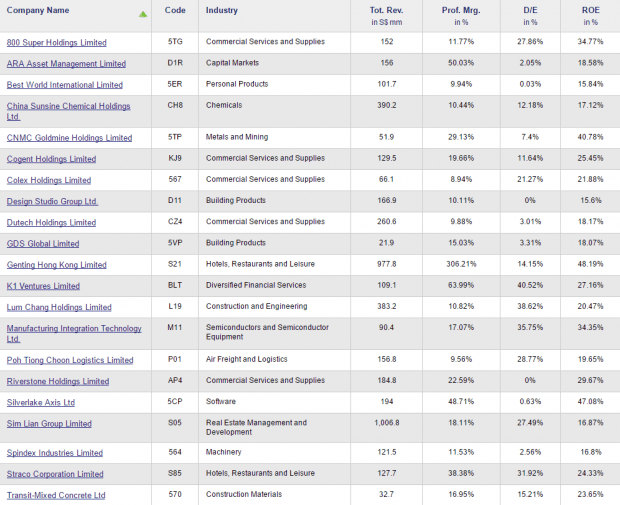
Source: SGX StockFacts
As you can see, out of 776 companies listed on the SGX, only 21 pass our criteria. This drastically narrows down your focus and allows you to save time by concentrating on these companies.
Similarly, whenever you come across a potential stock investment, going through its financials first will let you know whether that idea is worth exploring further.
Let’s have a look at Q&M Dental’s (SGX: QC7) five-year financials.
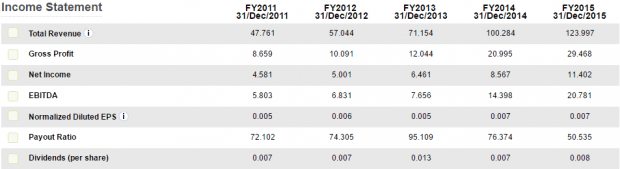
Source: SGX StockFacts
With a quick glance, I can tell that the company’s revenue has been growing steadily from $47.8 million in 2011 to $124.0 million in 2015. Gross profit and net income are both growing in lockstep as well with the latter more than doubling from $4.6 million in 2011 to $11.4 million in 2015. Diluted EPS is also inching up steadily.
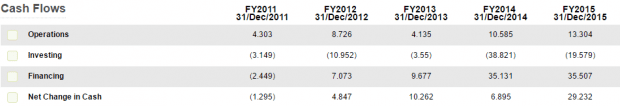
Source: SGX StockFacts
Cash flow from operations is also growing steadily from $4.3 million in 2011 to $13.3 million in 2015. Net change in cash is more erratic due to cash flows from investing; Q&M has been slowing acquiring dental chains in Singapore.
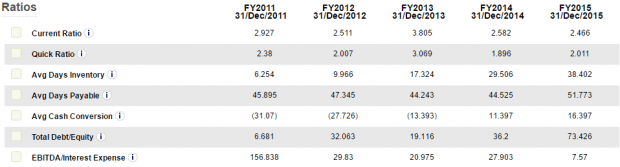
Source: SGX StockFacts
Q&M Dental’s current ratio is also comfortable above 2.0 which means they have ample liquidity to meet their short-term liabilities. Debt/equity has always been below 0.5 except for 2015 when the ratio hit 0.73. This technically fails our criterion but since everything else looks solid so far, we can choose to find out why the company’s debt has increased last year and if the reason for the higher debt is justifiable. Cash conversion cycle is very short at just 16 days and was even negative a few years back (a good thing!).
I could go on but from a quick screen of its financials, Q&M Dental seems like a company that has been performing and growing steadily over the last five years and has relatively manageable debt levels. This, of course, doesn’t mean that Q&M Dental is already a great investment idea; we still need to do our full due diligence.
I’d want to dig deeper to understand the company’s business model, how it has been engineering its growth (is the growth organic or through acquisitions?), the competitive risks the company faces and whether the management is aligned with shareholder interests. Valuation would then be the final step before the company passes ALL four quadrants.
If you’d like to try out StockFacts for yourself, you can just head to SGX StockFacts directly. It’s free to use and as you can see, it can help you save quite a bit of time screening potential investment ideas for you.
Also if you’re young and new to investing, SGX is organizing My First Stock Carnival 2016 on 7-8 May at Ngee Ann City Civic Plaza at Orchard Road from 11am to 9pm. If you have a keen interest to learn how to start investing ‘hands-on’ and want to know more about how to set proper investment goals and make savvy investment choices, swing by to visit the carnival.
This article was brought to you by SGX. Like the SGX Facebook page.
![]()


thanks for this ! it is very useful for a complete novice like me. Wondering if you have similar set of ratios for REIT?
You’re most welcome, Kevin!
Yes, we do. You can check out this article: https://fifthperson.com/5-important-factors-you-need-to-consider-before-you-invest-in-any-reit/