

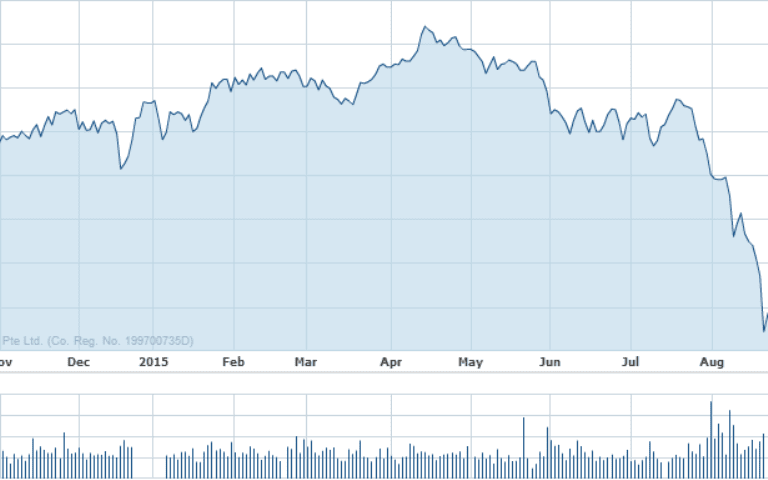
The Straits Times Index (STI) broke below the psychologically important level of 3,000 when it opened at 2,971 points on 21 August 2015. The index fell further and closed at 2,843 points the next trading day – an 18.9% drop from its peak of 3,531 points in April.
The STI has since rebounded slightly to 2,945 points but the big question on everyone’s mind is why did the STI drop so drastically?
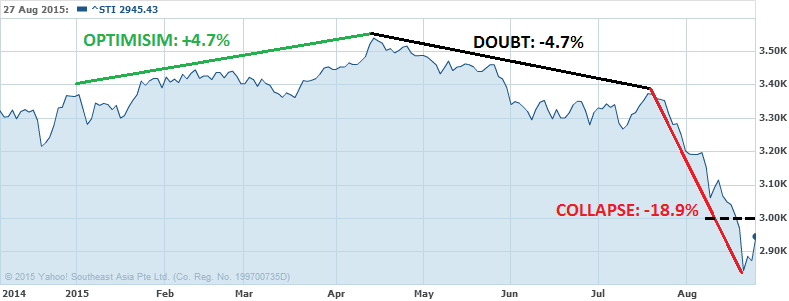
Chart: Yahoo Finance
Let’s explore what happened and look at how market optimism was built up in the first quarter, then how economic doubts surfaced in the second quarter before the crash we just witnessed in this third quarter.
First Quarter Market Optimism
2015 started highly optimistic and global economic growth seemed to gather steam early in the year. The U.S. led with excellent 2.4% growth for the full year of 2014. President Obama even boasted of this economic achievement in his State of the Union address. The Fed was talking about a June 2015 interest rate hike as unemployment numbers continued to fall and there were concerns about containing inflation.
Europe and Japan were the main spots of economic weakness but this was expected to pass soon. After all, their respective central banks were pursuing aggressive monetary easing as they modelled Ben Bernanke’s ultimately successful efforts to revive the U.S. economy.
As for China, the market was concerned that the economy only grew at 7.4% in 2014 just barely missing the 7.5% target set. It was acknowledged that growth was slowing as China’s economy reachs critical size and 7% growth was targeted for 2015. While this is considered slow growth for China, it is enviable growth for developed economies and not bad at all for the second largest economy in the world.
Singapore was expected to ride the coattails as global economic growth grew steadily with the U.S. and China leading the way and the STI rallied 4.7% from 3,370 points in January to its peak of 3,531 points in April.
Second Quarter Economic Doubts
Doubts started to creep in during the second quarter. The U.S. did not grow as much as expected and the results started to appear in May. Meanwhile, the “Grexit” crisis started to escalate and Greece defaulted on its IMF loan. The Greek prime minister called for a referendum to reject bailout conditions, raising contagion fears if Greece were to be kicked out of the Eurozone. The quarter ended with the Shanghai Composite crashing 40% from its June 12 peak.
However at that stage, things did not look entirely bad. In the U.S., unemployment continued to fall and home sales continued to rise, and Japan reported strong first-quarter growth of 3.9%. Greece would later capitulate to its creditors’ terms and conditions to a new bailout; for the time being, Europe would be saved. And the Chinese authorities would ultimately prevail in its effort to stem its stock market from falling further.
In other words, even though there was bad news in the second quarter, things were still under control overall. There was still room for reasonable expectations for recovery.
Third Quarter Assumptions Proven Wrong
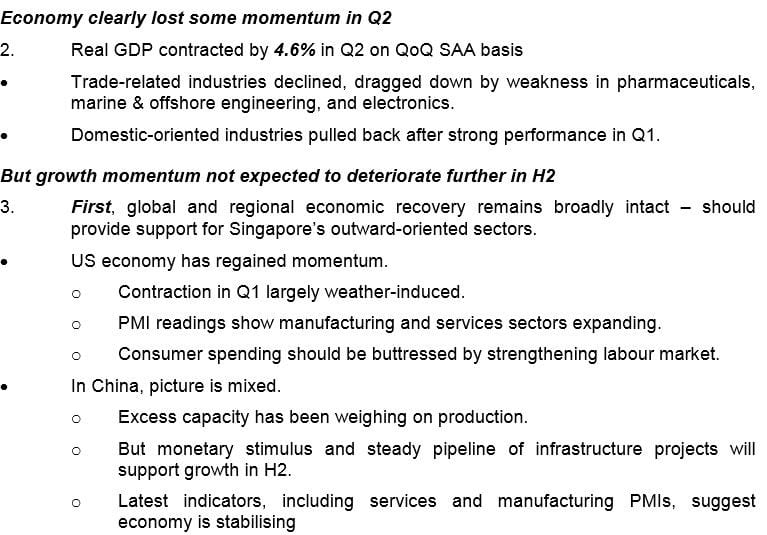
The first serious hint of trouble for Singapore came when the Ministry of Trade and Industry reported that Singapore’s GDP growth weakened by 4.6% in Q2 2015 from Q1 2015.
The Monetary Authority of Singapore stepped in on 21 July 2015 to reassure investors that Q2 weakness was temporary:
Source: Bank of International Settlements (BIS)
The MAS was not alone in its assumption that the U.S. and China would continue to lead the way towards economic growth. However, the doubts that surfaced in the second quarter were actually early hints of wider economic troubles instead of passing dark clouds.
So it is by understanding these expectations that were built up over the past seven months that we can understand the steep STI decline in August 2015.
4 Reasons for the STI Crash
- Weak U.S. Conference Board Data
- Extremely weak China Caixin Manufacturing PMI
- Renewed turmoil in Europe as Greek PM quits
- Renewed decline in oil prices due to recent report of excess inventory. Local oil refineries and oil services companies are badly hit. (Oil contributes 5% of Singapore’s GDP)
These factors put together raised fears in the markets causing the STI to finally cross below 3,000 points on August 21. The Greek crisis is nothing new so I will not discuss it here again. This may be a new development but it is essentially the same story of political instability in Europe. Oil prices have been declining since the second half of 2014. It rebounded from January to May 2015 before weakening again. So let me focus on the first two factors instead as they are relative new pieces of information.
The Conference Board data showed that U.S. growth momentum had slipped. The market expected the LEI to grow by 0.2% for July but it shrank by 0.2% instead. This shows that while the US economy is still strong, it is not as strong as expected.
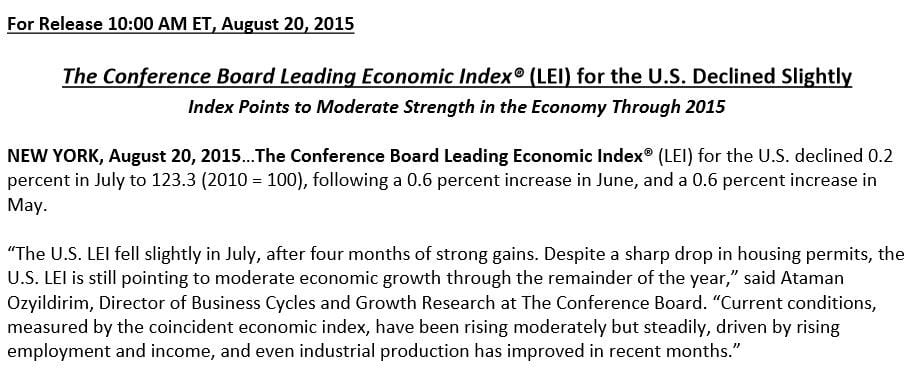
Source: Conference Board
While the U.S. lost growth momentum for July, it is at least still growing. The Caixin Manufacturing Purchasing Managers’ Index (PMI) revealed that China’s economic performance was downright horrible.
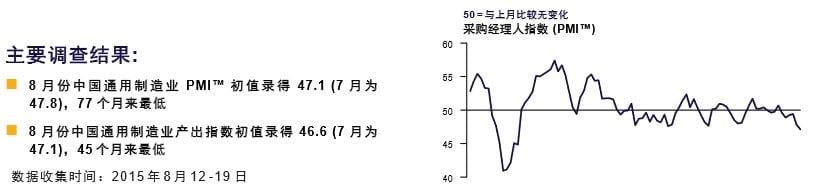
Source: Markit
Translated from Chinese, Chinese manufacturing fell to a record 77-month low of 47.1 points for the month of August. A reading below 50 actually means that manufacturing is shrinking. The fact that manufacturing output in the world’s factory is falling to six-year lows is sobering news.
The data was released on Friday, August 21 and the market had the entire weekend to digest the gravity of the news. When the markets opened on Monday, the Shanghai Composite Index plunged by a record 8.5% in one trading day.
The Fifth’s Perspective
After such a damaging report, the Chinese authorities might find it harder to stem the market plunge than they did the last time. Even if they ban short-selling, many stockholders would still want to sell their existing stocks pushing prices lower.
Another important takeaway is that the U.S. is no longer the strong economic pillar the world can continuously rely on as expected. The U.S. economy was described as the bright spot in the global economy by a Bloomberg poll in January 2015 and the markets believed that strong economic growth would be sustained for the full year.
However, evidence emerged in August to prove otherwise. The weak U.S. Conference Board report might have just led to a minor decline in the STI but the extremely weak Chinese PMI data gave a knock-out punch to the STI and other global indexes.
Basically the new reality is this: Japan and Europe continue to struggle with their own set of problems, China might no longer be the engine of growth, and the U.S. has lost its growth momentum for the time being.
But even if the markets continue to fall, it’s not all doom and gloom for the savvy investor. While some might want to wait on the sidelines for a while, falling markets give investors a huge opportunity pick up great stocks at bargain prices.
Maybe it’s time to start shopping?