


I covered the advantages of the S&P 500 ETF and how you can own the top 500 U.S. companies with just one ETF in my previous article. The growth of the S&P 500 is closely related to the growth of the overall American economy, so now let’s do some fundamental analysis and the recent performance of the broad U.S. economy in GDP terms before we consider its longer term context.
The U.S. economy did well for the second quarter of 2015. The Bureau of Economic Analysis (BEA) reported that the U.S. grew by 3.9% in the second quarter from the previous quarter, beating expectations of 3.7% growth. This is much better than the 0.6% growth in the first quarter of 2015.
![]()
Source: BEA
The BEA was more and more optimistic of U.S. growth as seen from its increasing estimates – from 2.3% to 3.9%. So the U.S. economy looks pretty solid according to its latest growth data but the challenge is to get ahead of the curve. What is the economic growth likely going to be for the U.S. moving forward?
To do this, I personally look at a few main economic indicators and I’ll highlight five reasons why I’m bullish on the U.S economy and the S&P 500 in the long term.
Before we move on, I’d like to state that economic indicators (like everything else) can’t ultimately predict which way stock prices will go, but they can give a good indication of where the economy is now and where it is likely to go moving forward.
Just like how the historical financial performance of a company can’t predict future stock prices, it can still give you an indication of how well the company has been performing and is likely to continue to perform.
So lets begin:
#1 Retail Market Conditions
U.S. consumers hold the key with their consumer spending and the performance of the S&P 500.
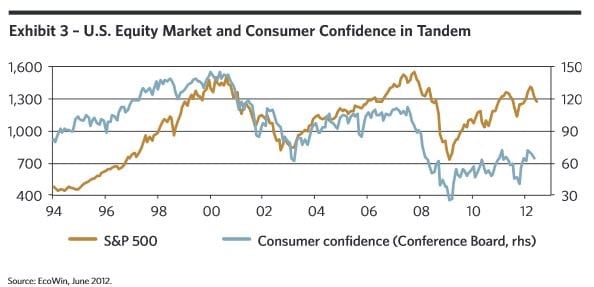
Source: BNY Mellon Asset Management
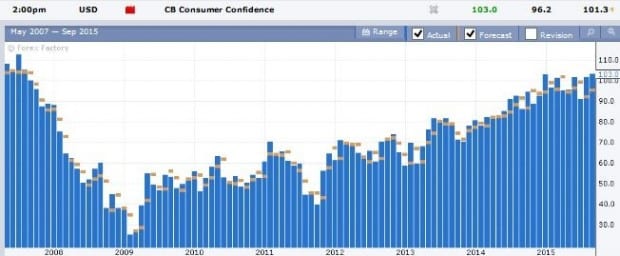
From the chart over the last 21 years, the relationship between consumer confidence and S&P 500 is positively correlated. As consumer confidence increases, the S&P 500 goes up as well and vice versa. The latest Conference Board reading of Consumer Confidence is encouraging as seen in the chart below:
Source: Forex Factory
The September 2015 reading shows that it has hit a new peak at 103.0 and this is better than analysts’ expectations of 96.2. A reading above 100 indicates that U.S. consumers expect a bullish economy going forward. In addition, you can see that consumer confidence is on a rising trend. The Census Bureau reported that U.S. retail sales grew by 0.7% in July but the momentum slowed to 0.2% growth in August; below market expectations of 0.3% growth.
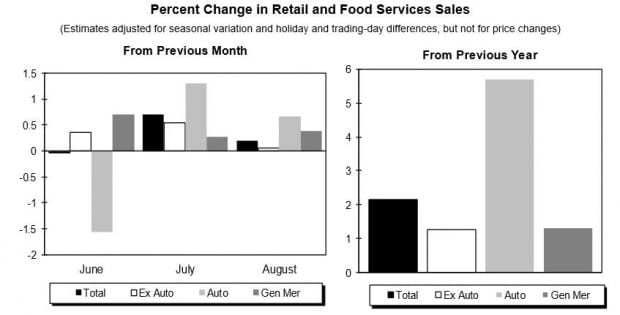
Source: Census Bureau
However, even though percentage growth in August slowed down, total spending is still rising overall. Judging from the strong consumer confidence, all things being equal, I expect continued growth momentum in spending to continue. This is because when consumers are confident about their future, they would naturally spend more. The August data is a mild disappointment (nobody said that the world is a bed of roses) but this sort of misses are normal. More crucially, this miss does not detract us from the strong overall consumption growth expected of the U.S. economy.
#2 Labour Market Conditions
The labour market condition has been a consistent bright spot of the U.S. economy. Unemployment has been on a decline since its peak of 10.1% in October 2009 and currently it stands at an all-time low of 5.1%.
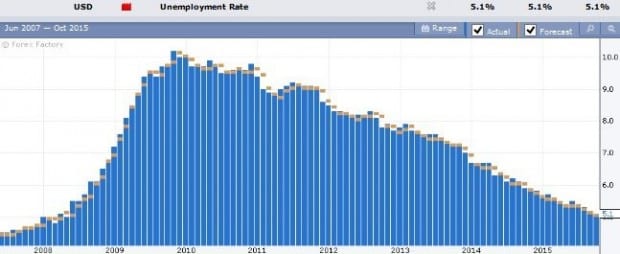
Source: ForexFactory
The U.S. labour market has been doing so well that the Fed has reduced its target unemployment rate from 5.0-5.3% to the range of 5.0-5.1% for year 2015. However it would seem that the U.S. labour market has weakened slightly where September is concerned. Non-farm employment grew by 142,000 instead of the expected 201,000. Wage growth stayed flat at 0.0% compared to 0.2% growth expectations for September. It is only natural that after employment numbers and wages have gone up consistently for some time that it would moderate after a while. Still I would like to point out that the overall U.S. labour market, which is powering the U.S. economy, is seeing its lowest unemployment rate in years.
#3 Purchasing Managers’ Index
The U.S. Purchasing Managers’ Index (PMI) measures the expansion of both manufacturing and non-manufacturing sectors in the country. A reading below 50 indicates a contraction and a reading above 50 indicates an expansion. The Institute of Supply Management publishes the PMI every month and this is the summary of their results for September:
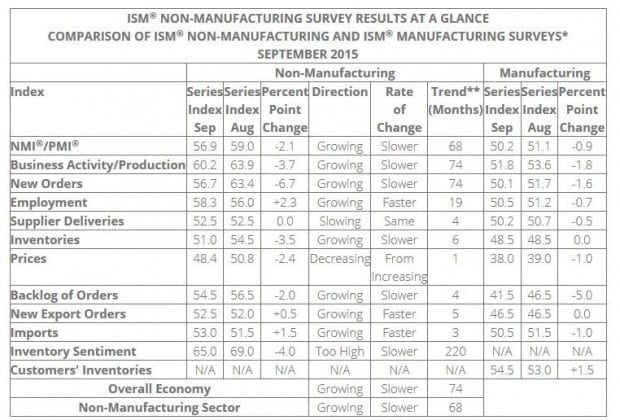
Source: ISM
It is clear from their results that the overall economy is still growing albeit at a slower pace.
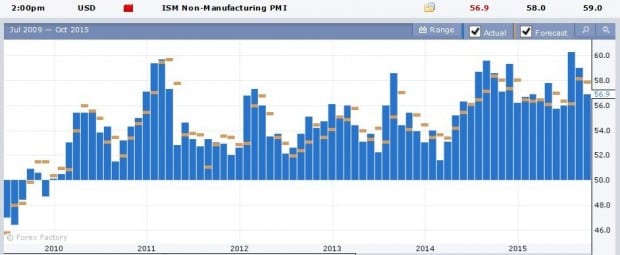
Source: Forex Factory
As you can see from the chart above, the PMI has been consistently above 50 since 2011 – four years of expansion.
#4 Delay in Fed Rate Hike
I had been anticipating a Fed interest rate hike this year previously. However this is before the heightened volatility in China’s equity market which has made the Fed more cautious recently. This has prevented the Fed from making its move so far. This can be seen in the September 2015 FOMC minutes which was released recently on 08 October 2015.
This quote is referring to China’s stock market troubles:
“Over the intermeeting period, the concerns about global economic growth and turbulence in financial markets led to greater uncertainty among market participants about the likely timing of the start of the normalization of the stance of U.S. monetary policy.”
Basically the Fed is trying to say that they don’t dare to raise interest rates because this might cause China’s equity market to drop drastically again and pull the world into another recession. China is now the world’s second largest economy and if China falls in deep trouble, the whole world is affected.
“Growth in real GDP over the first half of the year was stronger than participants expected when they prepared their June forecasts, and the unemployment rate declined somewhat more than anticipated. Participants made only small adjustments to their projections for economic activity over the medium term. They continued to anticipate that, with appropriate policy accommodation, the pace of expansion of real activity would remain somewhat above its longer-run rate over the next two years and lead to further improvement in labor market conditions.”
This is the Fed’s bullish assessment of the U.S. economy going forward. If not for China’s troubles, the Fed would probably already have risen interest rates.
#5 Long-term Growth in Overall U.S. Economy
The overall U.S. economy has been growing strongly over the past five years.
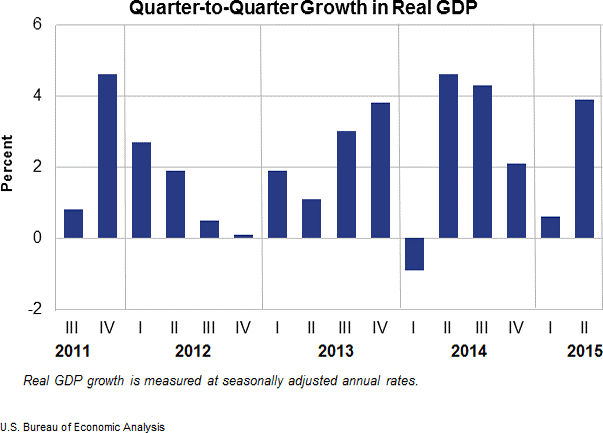
Source : BEA
The U.S. has been on a multi-year recovery after the global financial crisis. The robust growth in 2010-2013 was criticized as a result of Fed easing. After the Fed ended its Troubled Asset Relief Program in October 2013, GDP still continued to grow (except for the harsh winter in the first quarter of 2014). The U.S. economy continued to grow by 2.4% for the entire year of 2014 and continues to grow so far in 2015.
Conclusion
Warren Buffett once said that we should be greedy when others are fearful and fearful when others are greedy. This contrarian approach was most evident when global markets were still reeling from volatility in the Chinese stock market.
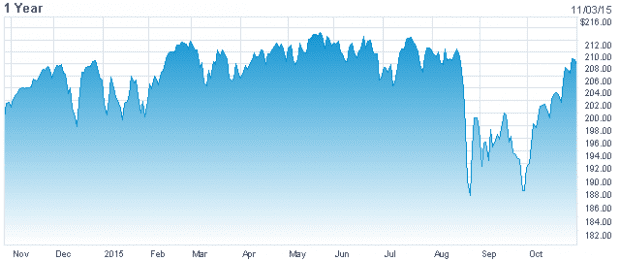
SPY Chart: NASDAQ
It is clear from the chart above that the August plunge was due to China’s Black Monday. The SPY made a double-bottom reversal and recovered to pre-crash levels in a month – a 14.8% gain. Right now, I feel that prices are still reasonable at around 18-19 times earnings which is near the historical norm. You can refer to this article for more details why a P/E of 18.5 for the S&P 500 is reasonable for a buy-and-hold investment strategy.
All in all, I think the conditions are good for the U.S. economy to continue leading a global economic recovery for the mid to long term and the P/E of the S&P 500 is reasonable right now. But if you’re looking for value, you might have to wait for a better price.
There is never a “perfect time” to invest and we should always weigh the risk and rewards of each individual investment but if you’re looking to ride on the U.S economy for the mid to long term, the S&P 500 is great way to do so.
Find out more about ETFs: A Simple 4-Step Introduction to ETFs


Hi FP
I last saw from sgx site that spy only havr 50 trades per day. Isn’t it too illiquid? Could that be the reason why it id not popular? And together with the high investment cost of min $20k per 100 shares?
Frugal Daddy
Hi Frugal Daddy,
Thanks for coming by! The S&P 500 ETF on the SGX is relatively illiquid and at $200 per share, you’re right, the minimum sum for one lot of a hundred shares is $20K. The S&P 500 ETF listed on the NYSE, on the other hand, is extremely liquid (it’s probably the most liquid stock on the exchange) and the minimum you need to invest is just one share.
If you plan on investing in the US-listed S&P 500 ETF, it’s best to go through a US broker (preferably one with a local office for support). The commissions are lower and you save on the custodian fees that a Singapore broker normally charges when holding foreign stocks.
Please note that foreigners are subject to 30% withholding tax on dividends for US stocks, so it doesn’t make sense to invest in the S&P 500 for dividends. There’s also estate tax on US assets when you pass on. While the obvious solution is to simply liquidate your US stocks (there is no capital gains tax) and withdraw your funds before death, this unfortunately doesn’t cover the scenario of one passing on suddenly.
Which seems like a perfect time to bring up this famous quote: “Nothing is certain except death and taxes.”
Hi Kai Kiat and FP
Thanks for the sharing.
As we know, there are countries that have their S&P500 versions too. What I know of is Hong Kong’s? Are you aware of any country that have this counter but available to Singapore’s investors with minimum tax payable by us?
put together enough charts and links and you can justify anything
Hi Frugal Daddy,
For SPY, it is indeed better to purchase on the US market for liquidity.
Hi Joel,
We all take a view when we take positions on the market. If you are bearish on the US economy, you are welcomed to sell the SPY. There are people who are willing to buy it.
The CAPE ratio of S&P500 is the 2nd/3rd highest in the ~100 years of history, i think it is not difficult to figure out the probability of making outsize returns in the next 5-10 years if one were to invest in S&P500 at today’s valuation.