
This will be the final instalment in the Battle of the Telcos series and I believe you over the last three articles have a clearer grasp of Singtel, M1 and StarHub’s business models and the unique strengths and challenges each company has.
For this instalment, we are going to analyze five key financial metrics across Singtel, M1 and StarHub and conclude which telco is best positioned to handle the increased competition that’s going to arise when the forth telco comes online in Singapore soon.
So let’s begin:
5 Key Metrics to Examine in Singtel, M1 & StarHub
#1 Net Profit Growth
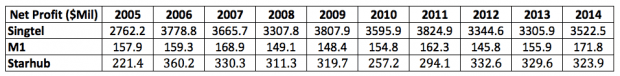
Singtel, M1 and StarHub have consistently grown their net profit for the past ten years. While that may sound like good news, the growth has been rather lackluster; the average annual growth rates are 2.74%, 1.38%, and 4.32% for Singtel, M1, and StarHub respectively. M1 has the lowest profit and growth among the three.
#2 Net Profit Margins
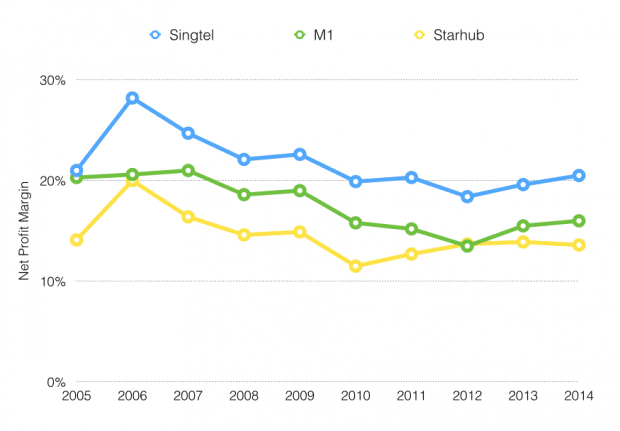
The net profit margins of Singtel, M1 and StarHub have been decreasing overall and stabilized only from 2010 onwards. The falling margins are an indication of growing competition among the telcos as they fight for same consumer dollars in a small local market. Singtel is an exception as they have regional operations and their net margin of 20.5% is highest among the three.
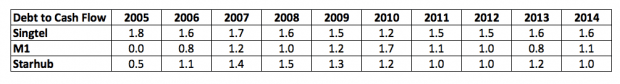
#3 Debt-to-Cash-Flow Ratio
Debt-to-cash flow is an important ratio for because telcos often borrow high loan amounts to finance their business operations. They’re able to take on higher levels of debt because their business models allow them to generate extremely predictable cash flows. For example, a customer is usually locked up for two years when they sign up for a mobile plan (and you can expect most customers to pay their bills on time every month).
Because telcos have relatively high amounts of debt, the traditional debt-to-equity ratio is a less useful measure. The debt-to-equity ratio doesn’t take into account a telco’s extremely predictable cash flows and the company might seem over-geared.
Instead, the debt-to-cash-flow ratio is more useful – it measures how quick a company can pay off its debt with its cash flow. For instance, Singtel’s debt-to-cash-flow is 1.6 which means they can repay their entire debt in just 1.6 years with their current cash flow. This shows just how high their cash flow levels are compared to the amount of debt they have.
A cash-flow-to-debt ratio below 3 is ideal and all three telcos pass this benchmark easily.
#4 Dividend-to-Free-Cash-Flow
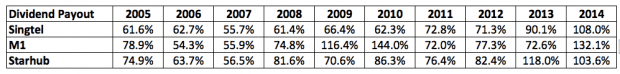
The traditional dividend payout ratio uses net profit in its calculations. But as you know, telcos usually generate high quality earnings which means their cash flows are equal or higher than their net profits. Profits are also depressed compared to cash flows due to higher deprecation amounts because of capital expenditure.
So I prefer to use free cash flow instead of earnings for a telco’s dividend payout ratio in this instance. From the table above, all three telcos have been paying consistent dividend payouts to shareholders over the last ten years – great news for income investors. In particular, StarHub has had the highest payout ratio among the three telcos in six of the last ten years.
In 2014, all three telcos paid dividends above their free cash flow. While investors in general prefer a higher dividend payout ratio, it is unsustainable to pay dividends above total free cash flow in the long run and this figure should come down eventually.
#5 Dividend per Share
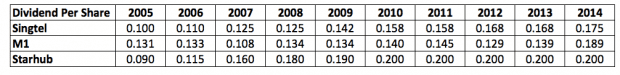
Note: Dividend per share figures exclude special dividends
Singtel and StarHub have consistently increased their dividend per share over the past ten years (StarHub has maintained it at 20 cents the last five years). M1’s dividend per share has been more volatile but is generally on an uptrend as well. So if you’re seeking stable/rising dividends as an income investor, Singtel and StarHub look like better picks based on their track record.
[****Want a List of Stocks That Pay Dividends Even During a Crisis? Here are 10 Dividend Paying Stocks Every Investor Should Have In Their WatchList – Click Here To Download****]
Conclusion
So from what we’ve analyzed here and from the last three articles, Singtel and StarHub are better positioned to handle the heightened competition when the forth telco enters the market, while M1 looks most at risk:
- Singtel doesn’t rely exclusively on the local market and they own regional operations which contribute a sizable portion of total revenue and profit. That’s already on top of having the largest mobile market share in Singapore due to their first-mover advantage.
- StarHub relies on its “hub” strategy of bundling their services together to offer higher overall value to their customers. The strategy has already proved successful as seen by the low churn rate StarHub has among customers who subscribe to all three of their mobile, broadband and cable TV services. StarHub also enjoys first-move advantage and has the largest cable TV market share in Singapore even despite Singtel’s entry into the market with mioTV.
- M1’s market share has been falling every year over the last ten years, their cost per acquisition is rising, and they have nothing to differentiate or diversify their products/services right now. The one possible bright spot is M1’s entry into the mobile point-of-sales industry this June. This industry is growing fast but this business segment is still new for M1 and has yet to be proven successful for the company. If M1 can grow this business segment and see it contribute a growing and significant amount to their total revenue and profits, it might be a game changer for them.
Well, I hope you’ve enjoyed this Battle of the Telco series and gained a clearer insight and analysis into Singtel, M1 and StarHub (especially if you’re invested in any one of them!).
Oftentimes, investors research a company on its own and invest based on one set of data and numbers. While the data and numbers might look impressive on their own, it is imperative you do a comparison with peers across the same industry to gain a more well-informed overall analysis.
For example, some of M1’s numbers might look great on their own but you’ll only truly know when you compare them with similar companies in the same industry – and sure enough, they pale in comparison next to Singtel and StarHub.
Yes, it’s a lot more extra effort to put in (and something we do before we invest in any company) but nothing ever worth it comes easily. So if you want to consistently pick the best companies to invest in, this is something you have to knuckle down and get done.
[**Love Dividends? Find out which stock is in our dividend watchlist – Click Here]

Hi, may I know how do you calculate the debt to cash flow ratio? Thank you!
Hi Marcus,
The debt-to-cash-flow ratio is a company’s total debt divided by its cash flow from operations.
So if a company’s total debt is $1 million and it annual operating cash flow is $2 million, its debt-to-cash-flow ratio 0.5.