

You may or may not have already heard that the U.S. treasury yield curve is at its flattest since 2007 – the year before the 2008/09 Global Financial Crisis. Is this a potential sign of things to come?
But before I delve into that, I guess a bit of background information is in order.
What is the yield curve?
The yield curve shows the spread (difference) between the interest rates of short-term and long-term U.S. Treasury bonds. For example, the current interest rate (as at 28 June 2018) for the 10-year U.S. Treasury bond is 2.83% and the interest rate for the one-year U.S. Treasury bill is 2.33%, therefore the spread is 0.5 percentage points.
Usually, interest rates for long-term bonds are higher than for short-term bonds. And rightly so because investors demand a higher yield for locking their money away for a longer period of time, which brings greater risk and uncertainty. In this case, the yield curve is ‘normal’ and slopes upward.
But when the spread between long-term and short-term yields starts to narrow — either by long-term yields falling and/or short-term yields rising — then the yield curve becomes flatter.
If long-term yields become even lower than short-term yields (which obviously doesn’t make sense in the long run), then the spread becomes negative and the yield curve is ‘inverted’ and slopes downward.
So what happens when the yield curve is inverted?
Historically whenever the yield curve becomes inverted, it is a strong signal that the U.S. is about to enter a recession. Have a look:
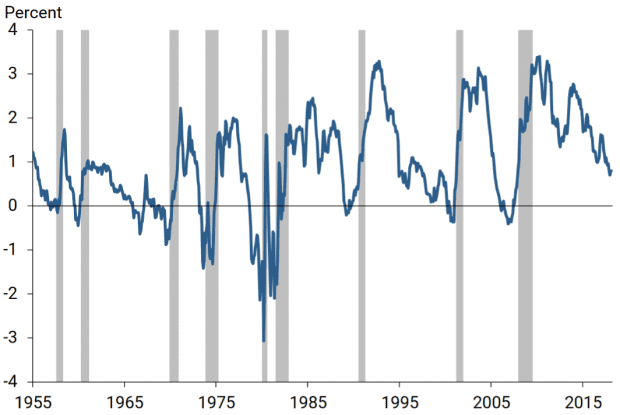
Source: Federal Reserve Bank of San Francisco
The chart above is the yield curve spread between the 10-year and one-year U.S. treasury yields from January 1955 to February 2018. The grey areas indicate periods of recession. As you can see, every U.S. recession in the past 60 years has been preceded by an inverted yield curve (i.e. the spread goes below zero). Amazing, really.
According to the Federal Reserve Bank of San Francisco economic letter:
“Every recession over this period was preceded by an inversion of the yield curve… and had only one false positive, in the mid-1960s, when an inversion was followed by an economic slowdown but not an official recession.”
And when the U.S. sneezes, the world catches a cold.
Why does an inverted yield curve signal a possible recession?
If investors are optimistic that economic growth will continue for the long term and expect interest rates to rise, many will prefer short-term bonds now (instead of long-term bonds) in hopes of securing a higher yield later. The lower demand for long-term bonds means long-term yields rise faster compared to short-term yields, widening the spread.
However, when investors start to become pessimistic about long-term growth and expect interest rates to fall in the future, many will now purchase long-term bonds to lock in yields before they fall. The higher demand for long-term bonds now leads to long-term yields slowing or falling, narrowing the spread.
When it reaches a point where long-term yields are even lower than short-term yields, we have a negative spread (an inverted yield curve) – a scenario where investors are so pessimistic about long-term growth, they prefer to secure lower yields for long-term bonds now than risk higher yields for short-term bonds.
Therefore, a narrow/negative yield curve spread may signal that long-term investor confidence in the economy may be waning, even though it may still be booming right now.
At the moment, the Fed has been raising short-term interest rates to control inflation in the growing U.S. economy. However, long-term interest rates have been slower to rise which suggests that investors are becoming less optimistic on long-term growth.
The fifth perspective – what next?
It’s also important to note that while the U.S. yield curve spread is at its lowest since 2007, it is not yet negative. Right now, the spread between the 10-year and one-year U.S. Treasury bonds is 0.5 percentage points.
And even if the yield curve inverts, it can’t predict when a recession will happen. The above study by the Federal Reserve Bank of San Francisco noted that a recession came in as little six months to as long as two years. So the music may go on playing for some time.
But whether you decide to use the yield curve as an indicator or not, it’s good to note that the S&P 500 has risen 287.7% since March 2009. As it is, the stock market is looking rather expensive right now with the S&P 500 P/E ratio at 24.57 (as at 28 June 2018), compared to its historical median of 14.69.
The U.S. has been on a tremendous nine-year economic bull run since the Global Financial Crisis. But every economic expansion is followed by a recession — we all know that.
The only question is… when?
Hi Adam,
Does that economic cycle tweaks or changes Fifth Person’s investment strategy? i.e. factoring in a more margin of safety when it comes to price entry?
In previous Dividend Machines and Investment Quadrant, have heard that Fifth Person usually do not get disrupted by economic noises.
Thanks,
Joo Parn
Hi Joo Parn,
That’s a great question. You’re right — we’re more bottom-up investors rather than top-down.
At the same time, economic cycles and market valuations give us a gauge of how bullish the stock market is. We’re naturally more conservative when the market is expensive, bargains are harder to find, and we tend to conserve more cash.
On the other hand, if the stock market is cheap and good opportunities abound, we tend to be more aggressive with our capital deployment.
Hi,
What is your opinion regarding Fed “replacing” the yield curve spread with the near term fed fund forward spread as a recession indicator?
https://www.federalreserve.gov/econres/notes/feds-notes/dont-fear-the-yield-curve-20180628.htm
Hi Lori,
As with any indicator, I wouldn’t blindly follow it to the hilt. It’s just another signal to help with your decision making if you agree with its arguments.