
Founded in 1991, Wilmar International Limited is a leading agribusiness group in Asia. As of 23 September 2019, Wilmar is worth US$23.9 billion in market capitalisation and is one of the 30 largest listed companies on the SGX and a constituent of the Straits Times Index.
In this article, I’ll cover Wilmar’s latest annual results, growth plans and stock valuation. Here are 10 things to know about Wilmar before you invest:
1. Wilmar derives revenue from four key segments: Tropical Oils, Oilseeds and Grains, Sugar, and Others (Fertiliser & Ship-Chartering Services). Below is a segmental breakdown of Wilmar’s 2018 revenue:
| Segment | Revenue (US$ millions) | Percentage of Total Revenue |
|---|---|---|
| Tropical Oils | 16,945 | 38.1% |
| Oilseeds and Grains | 22,472 | 50.5% |
| Sugar | 4,014 | 9.0% |
| Others (Fertilisers & Ship Chartering) | 1,066 | 2.4% |
2. Wilmar’s tropical oil segment has an integrated business model that encompasses the entire value chain of palm and lauric oils. Wilmar is currently the largest listed oil palm plantation company in the world. As of 31 December 2018, Wilmar has 230,409 hectares of oil palm plantations with 66.4%, 25.2%, and 8.4% of total planted area located in Indonesia, Malaysia, and Africa respectively. Weighted average age of oil palm plantations is 11 years. And in case you’re wondering (due to the recent haze in the region), Wilmar has a strict no-burning policy and is one of seven found members of the Fire Free Alliance — a multi-stakeholder group for the management of haze and fire problems in Indonesia.
| Plantation Age Profile | Planted Area (Hectares) | Planted Area |
|---|---|---|
| 0-3 Years | 35,466 | 15.4% |
| 4-6 Years | 30,727 | 13.3% |
| 7-14 Years | 101,075 | 43.9% |
| 15-18 Years | 22,075 | 9.6% |
| >18 Years | 41,066 | 17.8% |
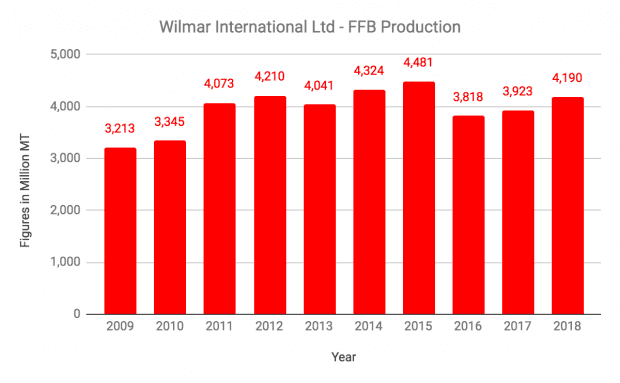
In 2018, Wilmar produced 4.2 billion metric tons (MT) of fresh fruit bunches and supplies almost 100% of its production to its manufacturing and merchandising division.
3. Wilmar is also the largest global processor and merchandiser of palm & lauric oils with a distribution network encompassing over 50 nations. In 2018, Wilmar (inclusive of subsidiaries and associates) has 253 plants specialised in various functions:
| Type of Plant | Number of Plants | Total Capacity (Million MT/Year) |
|---|---|---|
| Refinery | 180 | 34 |
| Oleochemicals | 24 | 2-3 |
| Specialty Fats | 35 | 2-3 |
| Biodiesel | 14 | 3-4 |
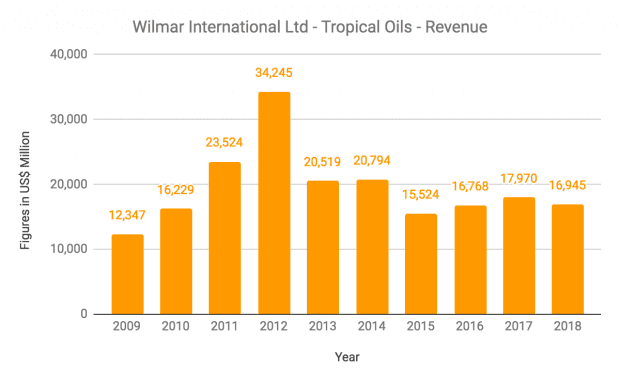
Overall, the tropical oil segment has sustained revenues of US$15-20 billion annually since 2013. Its record revenue of US$34.2 billion in 2012 was due to higher palm oil prices.
4. Wilmar’s oilseeds and grains segment is involved in oilseed crushing, flour & rice milling, and production of rice bran oil:
| Type of Plant | Number of Plants | Total Capacity (Million MT/year) |
|---|---|---|
| Crushing | 99 | 39 |
| Flour Milling | 41 | 9 |
| Rice Milling | 23 | 4-5 |
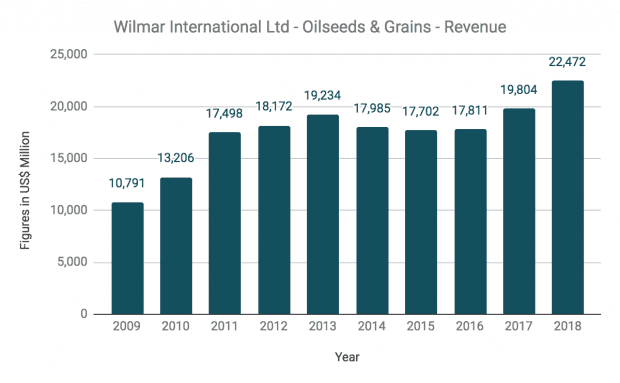
Wilmar is also the world’s largest producer of consumer-pack edible oils with operations in China, Indonesia, India, Vietnam, Bangladesh, Sri Lanka, and several African countries. In 2018, Wilmar had a 45% market share of China’s edible oil market. Over the last 10 years, this segment has achieved a compound annual growth rate of 8.5% in revenue, from US$10.8 billion in 2009 to US$22.5 billion in 2018.
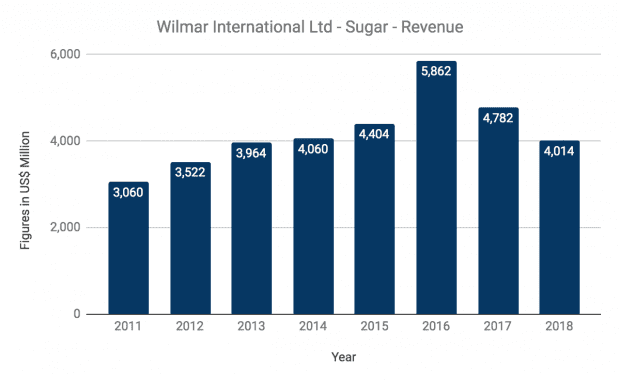
5. Wilmar also owns an integrated sugar business in Australia, India, and Myanmar, and beet plantations in Morocco:
| Type of Plant | Number of Plants | Total Capacity (Million MT/year) |
|---|---|---|
| Sugar Milling | 24 | 31 |
| Sugar Refining | 8 | 5 |
This segment has reported back-to-back declines in revenue, from US$5.9 billion in 2016 to US$4.0 billion in 2018. This is due to a drop in sales volume and sugar prices.
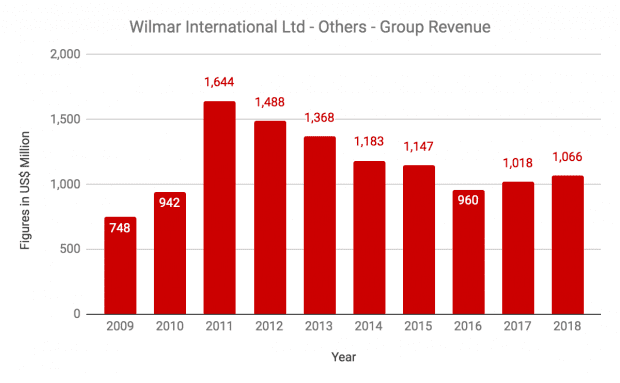
6. Wilmar’s other businesses include its fertiliser operations in Indonesia, and the ownership and management of 65 tankers/dry bulk vessels with a total tonnage of 2.3 million MT. Revenues for this segment have declined since it hit a peak of US$1.6 billion in 2011.
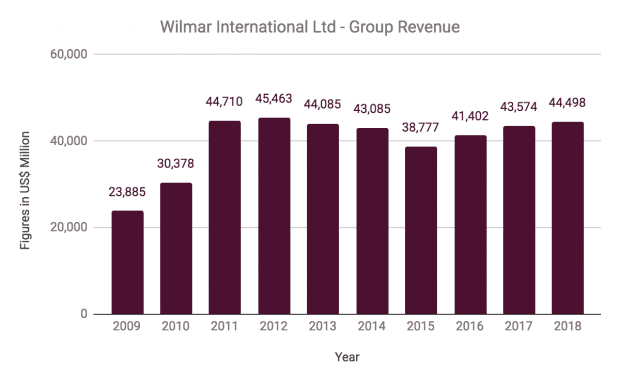
7. Wilmar has maintained its group revenues at US$40-45 billion annually since 2011. Growth from its oilseeds and grains segment was offset by weaker sales from other segments.
Shareholders’ earnings have slowly declined from US$1.9 billion in 2009 to US$1.1 billion in 2018. This is mainly due to a fall in profits from the tropical oil and sugar segments during the period.
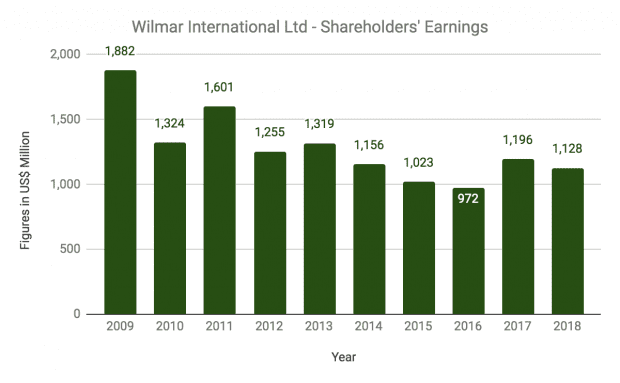
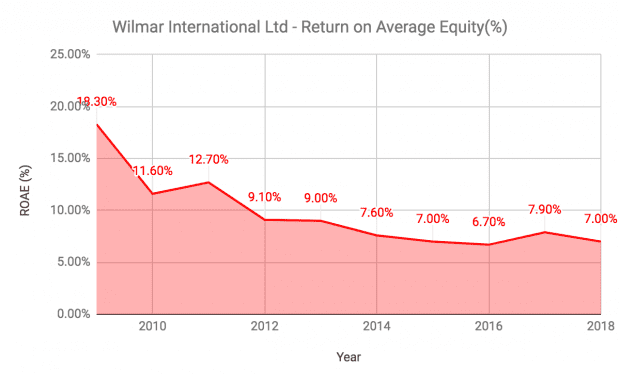
Likewise, Wilmar’s return on average equity has fallen gradually from 18.3% in 2009 to 7.0% in 2018.
8. Wilmar has announced its intentions to list its operations in China. The proposed listing is expected in the fourth quarter of 2019 and is currently in progress.
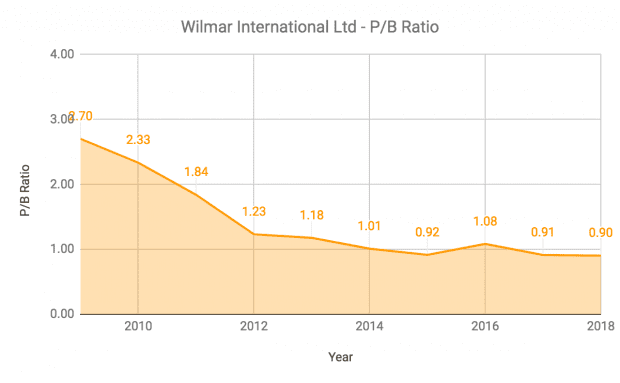
9. P/B ratio: As at 31 December 2018, Wilmar has net assets per share of US$2.537 (~S$3.476). Based on its share price of S$3.74 (as of 23 September 2019), its P/B ratio is 1.08 — which is higher than its five-year average of 0.97, but lower than its 10-year average of 1.41.
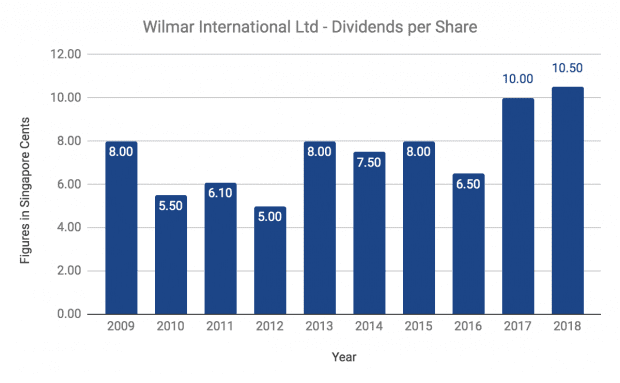
10. Dividend yield: In 2018, Wilmar paid a dividend per share of 10.5 cents.
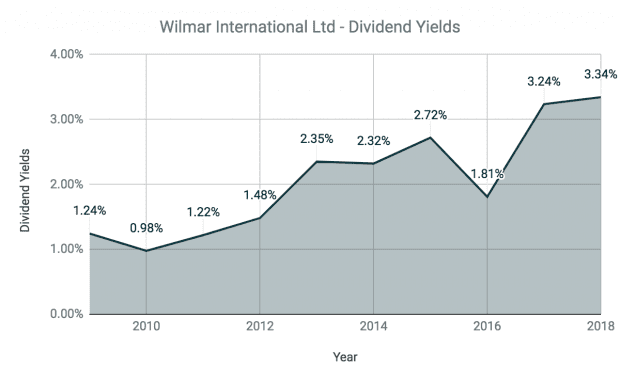
If Wilmar maintains its dividend, its yield is 2.81% — which is above its 10-year average of 2.07%.
The fifth perspective
While Wilmar has a strong downstream business and group profits have stabilised in the last few years, Wilmar’s profitability is still subject to movements in commodity prices.
Therefore, an investor in Wilmar has to be aware of the cyclical nature of the business and whether they are comfortable with its inherent volatility.