
For many retail investors, the search for “super stocks” often leads toward speculative tech or unproven startups. We often assume that once a consumer brand becomes a household name, its days of explosive growth are firmly in the rearview mirror.
Super Group was a classic example of this framing. By 2011, it was an established giant with a portfolio of over 200 instant coffee and convenience products, holding top-three market shares across Singapore, Malaysia, Thailand, and Myanmar. It was a stable, resilient business — but to the casual observer, it lacked a clear catalyst for multi-bagger returns.
A deeper look told a very different story.
How We Found It
We weren’t looking for Super specifically. We were screening for insider buying — companies where management was purchasing shares from the open market during the 2008/2009 recession, when most investors were running the other way.
Super’s chairman and directors were buying. That was the first signal.
The second was context. Super had spent years diversifying into non-core businesses — a common pattern among companies that lose focus as they grow. By 2010, management had reversed course entirely, divesting those non-core operations to concentrate back on what they did best: branded consumer products and raw ingredients.
A focused management team with skin in the game, buying their own stock at depressed prices. That combination warranted a closer look.
A Structural Data Point: The Ingredient Crossover
Super Group’s core business was well understood. What was less widely discussed was its Raw Ingredients segment — producing non-dairy creamers and soluble coffee powders for industrial users in Taiwan and China.
In 2006, this segment was a rounding error. It contributed just $1.5 million in sales, or 0.7% of total revenue. At that scale, even doubling the business would have been mathematically insignificant to the Group.
The tipping point arrived in 2010. By then, ingredient sales had quietly exploded to $58.2 million. A staggering 150% compound annual growth rate over four years! This moved the segment from an experimental sideline to 16.5% of total Group revenue.
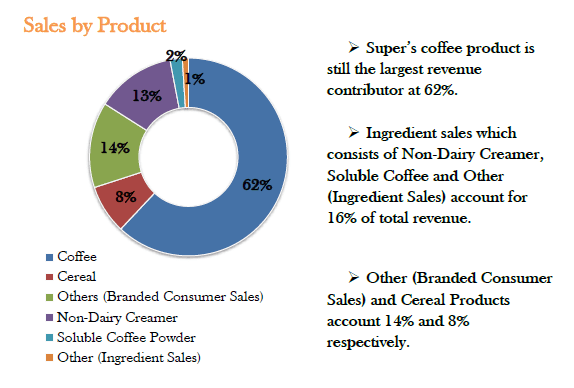
That crossover matters. Once a high-growth segment crosses a materiality threshold, incremental gains begin to move the total revenue line in ways they simply couldn’t before. When ingredient sales were 0.7% of revenue, explosive growth in that segment was a footnote. At 16.5%, it was a growth engine.
When Q1 2011 results showed ingredient sales doubling yet again, it was a clear leading indicator that the company’s growth trajectory had been structurally altered.
Capital Allocation as an Indicator of Intent
A catalyst is only sustainable if management builds the infrastructure to support it. Super Group’s management didn’t just stumble into this growth — they aggressively reallocated capital to capture it.
To meet surging demand from East Asia, the company completed two additional non-dairy creamer production lines at their Wuxi, China facility, expanding annual capacity from 75,000 to 125,000 metric tonnes. Separately, they broke ground on a new facility to produce freeze-dried soluble coffee powder — a premium product commanding higher margins than the spray-dried variety already in production. That plant was completed in June 2012, adding 1,500 metric tonnes of annual freeze-dried capacity.
These were not reactive decisions. They were structural commitments that signalled management’s confidence in the durability of demand — and their intention to capture a greater share of it.
This reinvestment was balanced alongside a shareholder-friendly mandate: a commitment to pay out at least 50% of annual profits as dividends. The combination of aggressive capacity expansion and disciplined capital distribution signalled a management team that was confident in their ongoing cash flow generation.
What the Financials Told Us
When we examined Super’s books, they told the story of a company that was not only growing but doing so with increasing efficiency.
Revenue had expanded steadily from $171.8 million in 2004 to $351.2 million by 2010. More tellingly, profitability had improved through the cycle — gross profit margins rose from 33.2% in 2008 to 37.2% in 2010, driven by higher-margin products, better cost management, and the economies of scale that came with expanded production.
During the Great Recession, when many businesses saw margins compress alongside falling revenue, Super posted stronger profit margins despite a modest revenue dip. That kind of resilience is a hallmark of a business with genuine pricing discipline and operational leverage.
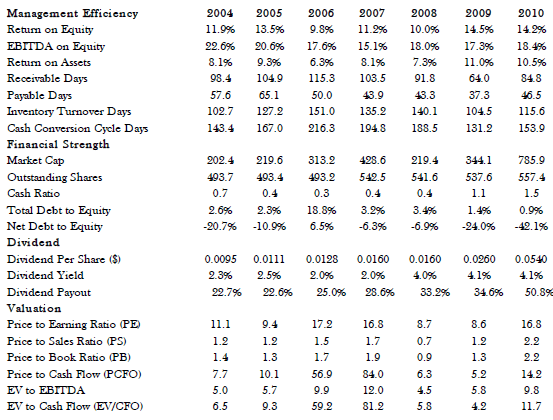
The balance sheet was equally reassuring. Cash and equivalents had grown to $141.7 million by 2010, with a debt-to-equity ratio of just 0.9%. The company was self-funding its own growth without needing to dilute shareholders or take on meaningful leverage. Return on equity stood at 14.2%, and EBITDA on equity — which we view as a cleaner measure of management’s ability to generate returns — came in at 18.4%, comfortably above our 15% benchmark.
Management as a Signal
Beyond the numbers, management behaviour told us as much as the financials.
The decision to divest non-core businesses and refocus on the core was a visible demonstration that management understood where their competitive advantages actually resided. Companies that chase diversification often do so at the expense of the businesses that earned them their reputation. Super’s reversal of that pattern was a meaningful signal.
The insider purchases made during the 2008/2009 downturn spoke for themselves. As Peter Lynch observed: “Insiders might sell their shares for any number of reasons, but they buy them for only one: they think the price will rise.”
Valuation: Paying a Fair Price for a Growing Business
In 2011, Super Group was trading at a PE of 15.6 and an EV/EBITDA of 9.8. While 9.8 was considered fair for a mature food company, it was remarkably cheap for a business whose fastest-growing segment was compounding at 150% annually.
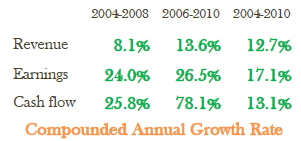
Using a conservative 15% growth projection, well below the 26.5% earnings CAGR the company had delivered from 2006 to 2010, we estimated Super’s intrinsic value at $1.78. At our entry price of $1.31 in March 2011, the stock was trading at approximately a 30% discount to that estimate.
We were not paying a premium for optionality. We were buying a financially sound business with a clear, already-validated growth driver, at a price that did not yet fully reflect where that growth was heading.
Why We Sold
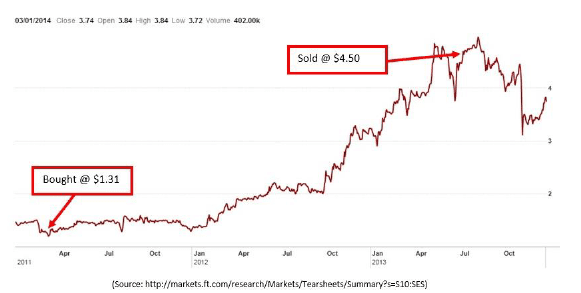
We bought Super at $1.31 in March 2011. By June 2013, we sold at $4.50 – a 243.5% return in just over two years.
The decision to sell was not based on price alone. It was based on a convergence of signals telling us the original thesis had largely played out.
First, ingredient sales growth. The engine that had driven the entire thesis had decelerated sharply, from 150% annually to 33%. Branded consumer sales were growing at just 1%. The exceptional growth phase that had justified our conviction was clearly moderating.
Second, the profit growth Super reported in Q1 2013 was not organic. It was driven by raw material cost reductions and a foreign exchange gain, neither of which could be counted on to repeat.
Third, the valuation had expanded significantly. At $4.50, Super was trading at a PE of 33 and an EV/EBITDA of 25, which is more than triple the multiples at which we had entered. Running a discounted earnings projection using an optimistic 25% growth rate, we arrived at an intrinsic value of $4.48. The stock was trading at almost exactly our bull-case estimate.
When a stock is priced for perfection and the underlying growth driver is decelerating, the risk-reward has fundamentally shifted. We sold.
The stock briefly touched $4.93 after we exited. It subsequently fell below $4.00. In hindsight, our decision to sell at $4.50 rather than chasing the final 10%, was the right one.
The Fifth Perspective
The market often prices established companies based on their legacy business, missing the “internal startups” that can quietly redefine their valuation.
In 2011, Super Group’s ingredient segment was growing at 150% annually – hiding inside a business most investors had already written off as mature. By the time we exited in June 2013, the narrative had caught up. The PE had expanded from 15.6 to 33, ingredient sales growth had slowed to 33%, and the catalyst had done its work. The “invisible” growth driver had become visible to everyone, and the valuation reflected it.
For investors, the takeaway is this: the most powerful catalysts are often hiding in plain sight, buried within the financial statements of companies the market thinks it already understands. When a small, high-growth segment finally reaches a tipping point in revenue contribution, moving from rounding error to a primary driver, it can turn a steady, overlooked compounder into a super stock.
The pattern, once you know how to look for it, tends to appear again.
Happy investing.