
Since the start of the pandemic, Apple’s share price has almost fully rebounded to its pre-COVID-19 high. In Apple’s recently released second quarter results on 30 April 2020, revenue increased 1% to US$58.3 billion while net income declined 3% to US$11.2 billion compared to the same quarter a year ago. While quarterly product sales declined by 3% year-on-year due to falling demand, revenue from Apple’s services business increased by 17% to a record amount.
For most part of the last decade, Apple was the undisputed global leader measured by market capitalization. Apple’s position was eventually displaced by Microsoft in November 2018, and for a few months in early 2019 the company slipped further to third behind Amazon. As of 10 May 2020, Apple sits in second place with a market capitalization of US$1.3 trillion.
What is at the core of Apple (no pun intended) that made it appealing for so long? And will Apple continue to shine? In this article we take a deep dive into Apple’s business and explore its key segments, financial performance, and potential risks.
1. Apple’s main competitive advantage lies in its brand ubiquity, design innovation, and customer loyalty which in combination allows it to enjoy strong pricing power. This is most evident from Apple’s ability to defend its margins. A look at Apple’s gross margin shows stability between 35%-40% in the past 10 years. This is testament to its product pricing power and position in the premium segment of the market.
Exhibit 1: Apple gross margin over the past 10 years
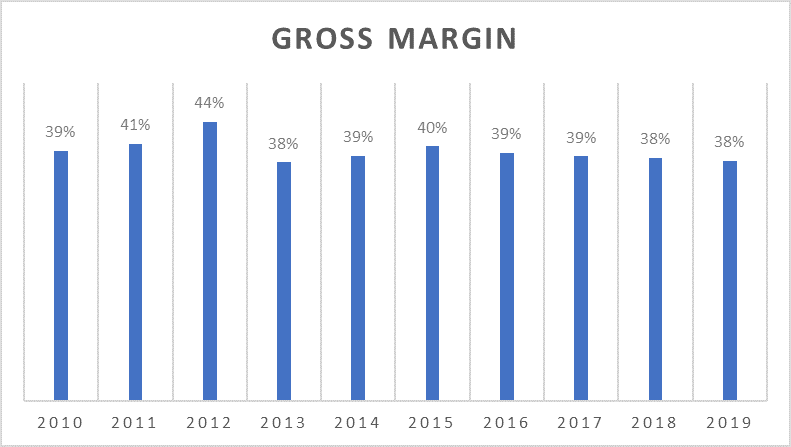
Source: Apple
Over the years, the company expanded and evolved its product line. Apple’s main products today are the iPhone, Mac, iPad, and Wearables (Apple Watch, AirPods, Home and Accessories, etc.). It also has a services business which include the delivery of streaming content, Apple Care, Apple Card, among others.
2. The iPhone remains core to the company. As of the latest 2019 financial year, iPhone revenue totaled US$142 billion and comprised 55% of total firm-wide revenue. Apple was originally counting on the anticipated iPhone 12 release later this year, however the launch is likely to be delayed given the collapse in consumer demand and manufacturing delays. Nevertheless, the iPhone 12 continues to generate buzz due to the highly awaited introduction of 5G capabilities.
Exhibit 2: FY2019 revenue breakdown by segment

Source: Apple
3. While the iPhone is the present, Wearables and Services represent the future. Both segments combined contribute to a significant 27% of Apple’s total revenue in 2019 compared to just 13% in 2015. More importantly, these two segments are the drivers of revenue growth. Annualized revenue growth in the past three years was 30% in 2019 for the Wearables segment, and 24% in the Services segment.
Exhibit 3: Three-year annualised revenue growth, FY2019
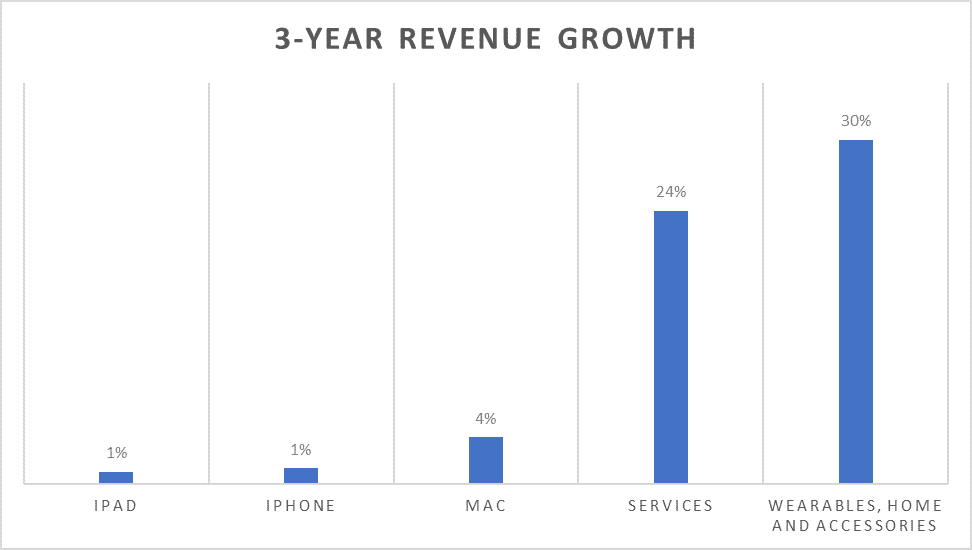
Source: Apple
As a wearer of the Apple Watch, what I am most eager to see is how Apple continues to develop its Health application. Currently with its ECG monitor, activity and heart rate trackers, and even a meditation function, Apple is in my opinion firmly in the lead when it comes to a holistic personal health tracker in built into a smartwatch. With the increasing emphasis placed on health and wellness these days, I think we might be seeing the advent of the Apple Watch.
4. Finally, while the Americas remain its top market at 45% of 2019 total revenue, exposure to Greater China is also significant at 17%. It is therefore important to monitor continued trade tensions between the United States and China. The outcome of which will have implications on tariffs placed on Apple’s products that will eventually trickle into lower profitability.
Exhibit 4: Share of 2019 total revenue by geography
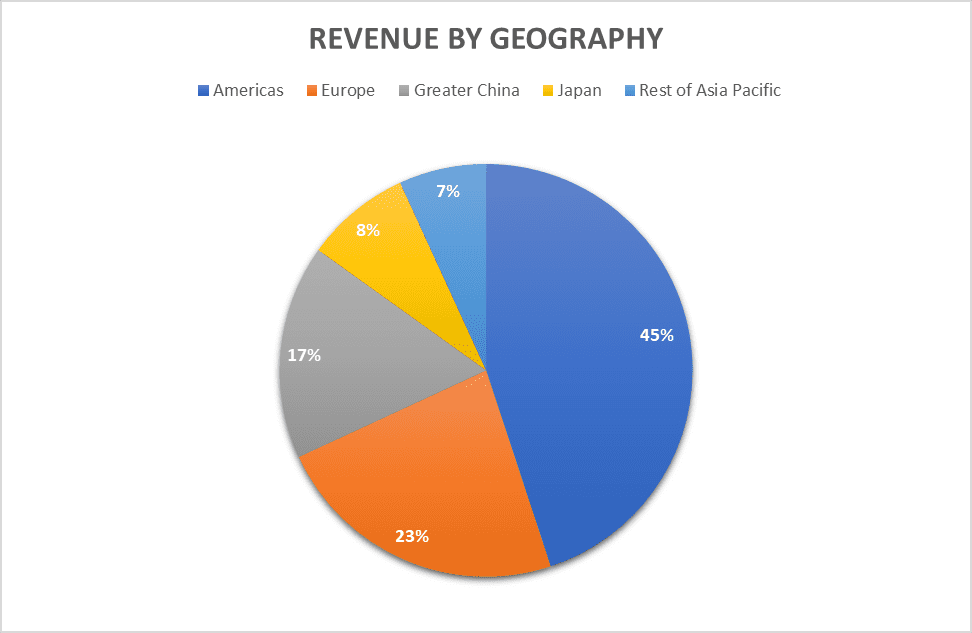
Source: Apple
5. Of top concern is how COVID-19 will negatively impact Apple’s product sales. Apple’s products have a high elasticity of demand and customers are therefore going to delay luxury purchases in the face of growing financial uncertainty. On February 17, Apple issued a revenue warning stating that they are unlikely to meet expectations due to manufacturing constraints and falling demand.
6. Last Thursday’s second quarter results validate the revenue warning, although Services is providing a strong countercyclical buffer. Quarterly sales of the iPad, iPhone and Mac declined 10%, 7% and 3% respectively compared to last year. Fortunately, this was mitigated by a 23% increase in sales from the Wearables segment. Looking forward, discretionary purchases such as the iPhone and Wearables are expected to take a greater hit than the iPad and Mac which are supported by demand for work and learn from home activities.
7. Earlier in April, Apple introduced a lower-cost version of the iPhone. Touted to be a phone with great performance for its price point, the iPhone SE is said to look like the iPhone 8 but with the internal specifications of the iPhone 11. This much heralded alternative was perhaps introduced at the most opportune time, given slowing economic growth and growing consumer price sensitivity. Apple will hope that sales of the iPhone SE can help mitigate falling sales in the premium iPhone segment.
8. Another concern is how a prolonged global shutdown will impact Apple’s supply chains. In its previous annual filings, Apple consistently cites key risks in its supply chain. COVID-19 has brought these risks firmly to the fore and could threaten the underlying operations of the company; one of which is supplier concentration risk. It will be important to observe if Apple undertakes to diversify its supplier source as one of the lessons learned from this pandemic.
A supply-related risk could lead to the inability to deliver on new products such as the new iPhone 12, as ‘the Company’s new products often utilize custom components available from only one source’. With the earlier shutdown of plants in Asia, delays to manufacturing, assembly and delivery of new products could threaten Apple’s performance.
Fortunately, in the latest quarterly results briefing, Tim Cook reassured investors that Apple’s production is back up and running. As much as Apple’s supply chains are proving to be resilient, it is important to note that its supply chains are global and integral to its operating viability. Therefore, clogs to any key nodes could pose a fundamental challenge for the company.
9. Apple’s main competition comes in the form of cheaper alternatives who can deliver on the same functionalities or specifications. This is true across its product segments. Be it Android-based products in the phone segment, or Windows-based products in the computer segment, competitors try to appeal to consumers’ price elasticity when trying to win Apple’s market share.
A quick comparison of Apple product prices in relation to its competitors will generally reveal this. However, Apple’s stable margins (Exhibit 1) prove that it has largely been successful at sticking to what it is good at – providing quality and user-friendly products with appealing designs.
10. Apple’s product and service diversification is both a boon and a bane. Diversification enables Apple to pursue revenue growth in other segments, as mentioned in the Wearables and Services segments, where gross margins are higher. For example, the Services segment reported a gross margin of 64% compared to only 32% in the overall Product segment.
Again, I applaud Apple’s efforts in entering the low-cost phone segment with the introduction of the iPhone SE. I believe this is an example of a well-conceived diversification strategy even if it risks self-cannibalisation. Such price discrimination will extend Apple’s customer base and allow it to capture greater consumer surplus.
Conversely, diversification might not be beneficial as it forces Apple outside of its traditional competencies. For example, in the area of streaming content, one can argue that stronger rivals exist in Netflix for video streaming and Spotify for music streaming. Large R&D investments in these areas might not yield the expected benefits if Apple is unable to provide the same depth of engagement as its competitors. One can only look back at the failure of Apple Maps to challenge the preeminence of Google Maps as an example against venturing outside of its domain expertise.
11. Finally, Apple operates in an environment of rapid technological obsolescence. There is a heavy requirement for continuous improvements to be made to existing technology and products to stimulate customer demand. Product life cycles are therefore extremely short, and it is incumbent on Apple to make heavy investments in Research and Development (R&D). Just think about the close to annual new iPhone releases and the burden of having to come up with drastically new specifications or features with each new release. In the absence of radical improvements to its offering, sales can easily slow and market share quickly lost.
12. Apple is undergoing a multi-year balance sheet transformation which began in earnest since 2014. This transformation is executed in the form of share buybacks which is changing the face of Apple’s capital structure. The origins of this phenomenon lie in Carl Icahn’s activist stake back in 2013, where he pressured Apple to distribute its enormous pile of cash sitting on its balance sheet via share buybacks. Today, even after Carl Icahn’s exit from Apple’s investor base, the company continues to undertake record amounts of share buybacks. Interestingly, Icahn’s exit in 2016 was around the time of Warrant Buffet’s entry into Apple.
Exhibit 5: Value of share buybacks conducted by Apple continues to rise

Source: Apple
It is instructive to reiterate Warren Buffett’s philosophy on share buybacks. He believes that share buybacks are a good investment that companies should undertake if it thinks its shares are undervalued. Perhaps this points to both Apple and Warren Buffett’s believe in the undervaluation of the company. One can only hope that it is not hubris, as the inability to reinvest its excess cash in profitable projects could be a sign of Apple’s struggle with innovation.
Share buybacks also creates the benefits of higher leverage. As seen from the exhibit below, the proportion of overall debt on the balance sheet has significantly increased in the past five years. This reduces overall cost of funding as debt is cheaper than equity. In addition, a lower cost of capital gives Apple a further boost to its valuation. Nevertheless, balance sheet risk remains low as outstanding cash and liquid investments close to cover total gross debt. One question remains: what is Apple’s long-term target capital structure?
Exhibit 6: Changing face of Apple’s capital structure: Higher debt and lower equity
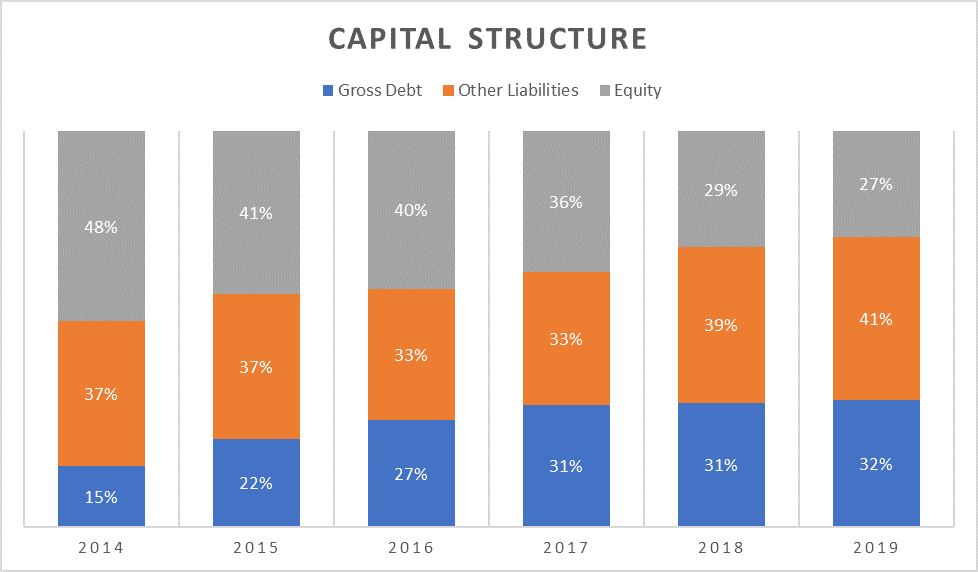
Source: Apple
13. Although Apple’s R&D spend has increased over the years, it still trails FAANG peers. In the latest financial year 2019, Apple spent US$16.2 billion on R&D which represents 6% of total revenue. R&D spend has increased by 17% on an annualised basis in the past three years.
Exhibit 7: Apple has increased R&D spend over the years

Source: Apple
However, compared to the average R&D to total sales ratio by FAANG peers of 14%, Apple’s 6% is significantly lower. One could argue that additional R&D expenditure above a certain point yields diminishing returns and is therefore unnecessary, but my personal view is that 6% seems low considering rapid technological obsolescence in the industry.
Luca Maestri, Apple’s CFO, previously stated that Apple’s ‘first priority is always looking after the business and making sure we continue to grow and invest’. Apple has the wherewithal to spend more on R&D and hopefully the pace of R&D spend will continue to increase going forward.
Exhibit 8: R&D spend (measured by R&D spend/total revenue) still trails FAANG peers
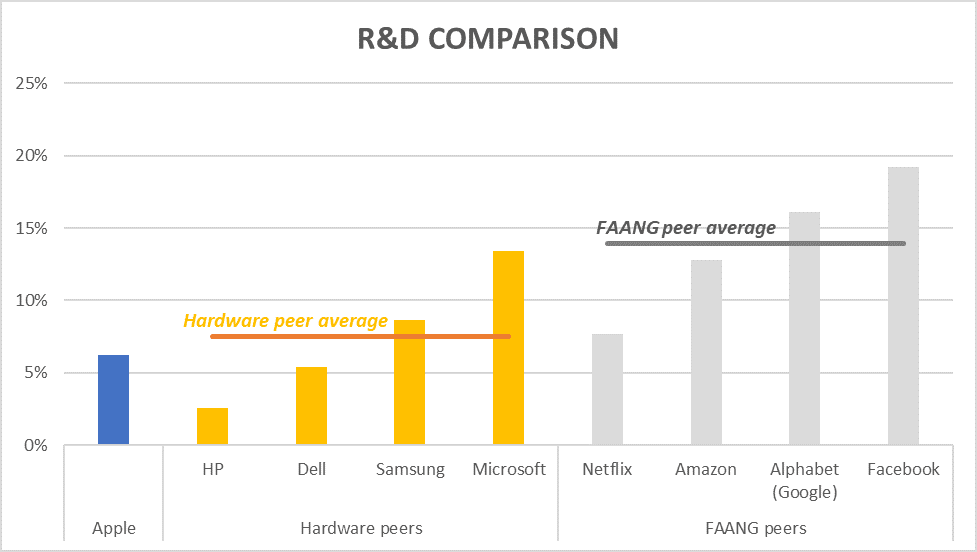
Note: Data as of latest 2019 financial year. Source: Capital IQ
14. Apple’s ability to consistently generate cash is commendable. There is no doubt that till this point, Apple is sitting on multiple cash cows. Worldwide sales of its products have enabled the company to be a beneficiary of significant liquidity. Cash flow from operations as a percentage of total revenue, at 27% in 2019, outperforms both hardware and FAANG peers.
Exhibit 9: 2019 Cash flow from operations / total revenue
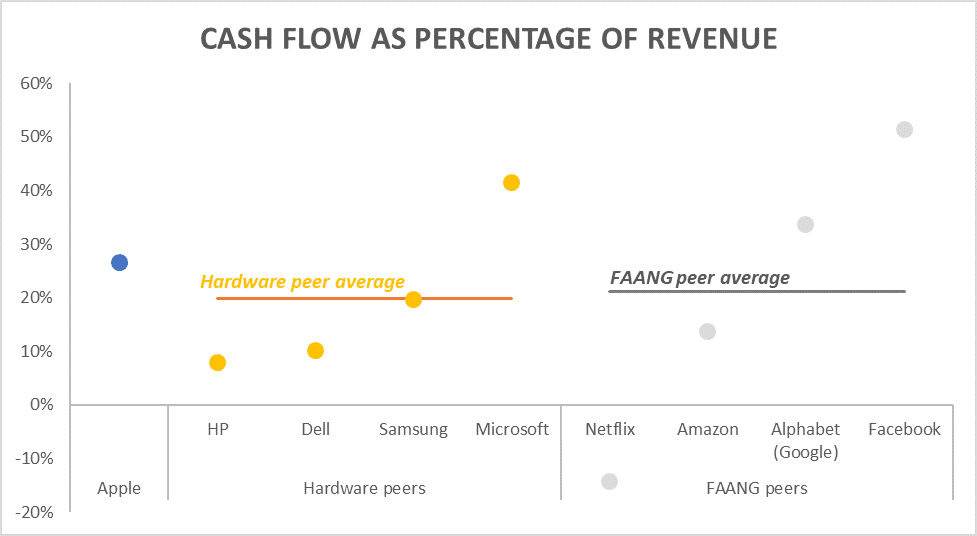
Source: Capital IQ
15. Best in class inventory management mitigates the curse of obsolescence. One of Tim Cook’s more memorable statements was his comment that ‘inventory is fundamentally evil’. Apple maintains limited warehouses and aims to ship products directly from the assembly plants especially from online sales. Apple’s 2019 inventory days outstanding, which measures the average number of days to turn inventory into sales, was far superior compared to its peers.
Exhibit 10: Average Inventory Days
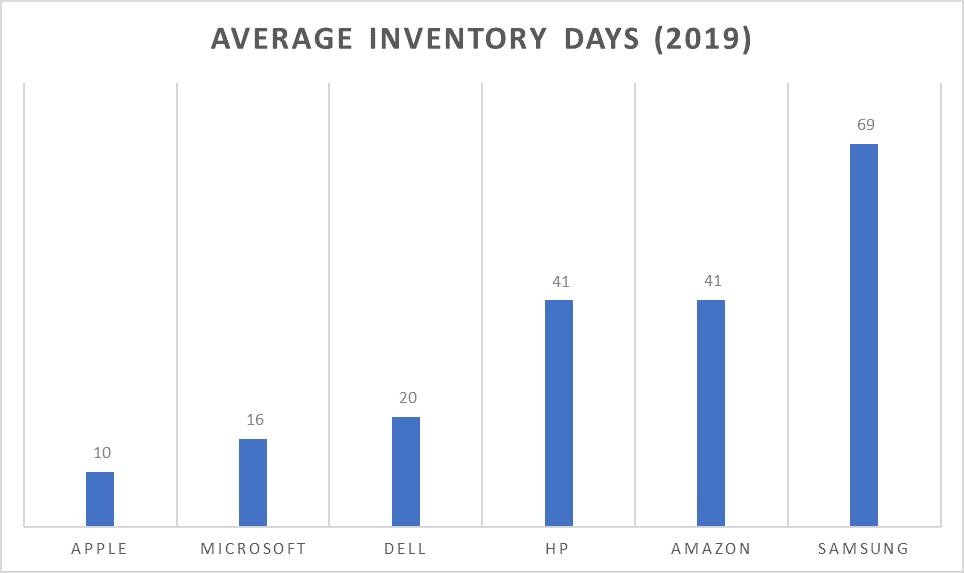
Source: Capital IQ
The fifth perspective
Apple’s design innovation, brand loyalty and pricing power are its key strengths. I like its shifting growth to wearables and services but will be watchful against them biting off more than they can chew. Apple’s best-in-class inventory management and strong cash flow generation also bodes well. Nevertheless, near term risks arise from falling demand and supply chain disruptions as a result of the COVID-19 pandemic. I will also be looking out for details on sales performance of the iPhone SE and the timeline of the iPhone 12 rollout.
Hi TWS, I have difficulty understanding these sentences and would appreciate if you could kindly enlighten me with a simpler explanation (I am a non-finance person!):
“This reduces overall cost of funding as debt is cheaper than equity. In addition, a lower cost of capital gives Apple a further boost to its valuation”
Thank you.
Thanks for your question, BY.
#1 The cost of debt, captured by the interest rate, is lower than the cost of equity. You can think of the cost of equity as the return that shareholders expect to receive from holding onto Apple’s stock – this includes both dividends and price appreciation. As equity is riskier than debt, the cost of equity is higher.
#2 Cost of Capital is the blended cost of all sources of capital for Apple (Debt + Equity). Lower cost of capital results in higher valuation as the present value of dividends is discounted by a smaller rate.