
Oversea-Chinese Banking Corporation (OCBC) is the second largest financial services group in Southeast Asia. The bank has built a significant presence in several key markets such as Singapore, Malaysia, Indonesia, and in Greater China. As of 10 June 2019, it is worth S$45.8 billion in market capitalisation.
In this article, I’ll bring an update on its latest financial results and its valuation. Here are 11 things to know about OCBC before you invest:
1. Loans and bills receivable has increased by a compound annual growth rate (CAGR) of 13.62% over the last 10 years, from S$80.9 billion in 2009 to S$255.2 billion in 2018.
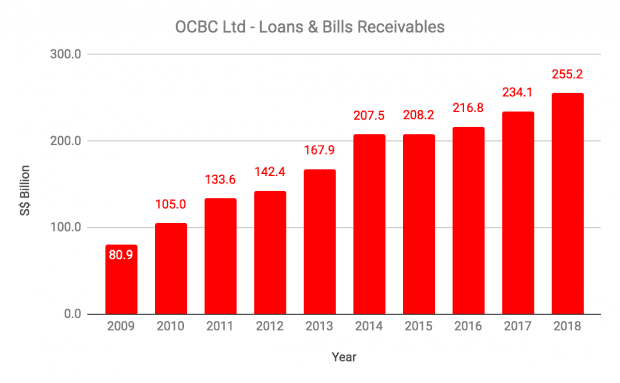
This is due to growth in OCBC’s key segments such as housing loans, building & construction, and general commerce.
| Key Segments | 2009 (S$ billions) | 2018 (S$ billions) | CAGR |
|---|---|---|---|
| Housing Loans | 21.5 | 64.8 | 13.06% |
| Building & Construction | 15.6 | 53.7 | 14.66% |
| General Commerce | 7.8 | 34.7 | 18.11% |
| Other Segments | 37.5 | 104.7 | 12.09% |
| OCBC’s Loans & Bills Receivables | 80.9 | 255.2 | 13.62% |
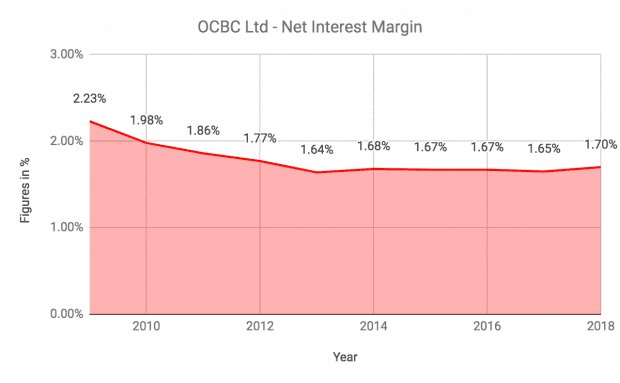
2. Net Interest Income (NII) has grown by a CAGR of 8.51% over the last 10 years, from S$2.8 billion in 2009 to S$5.9 billion in 2018.
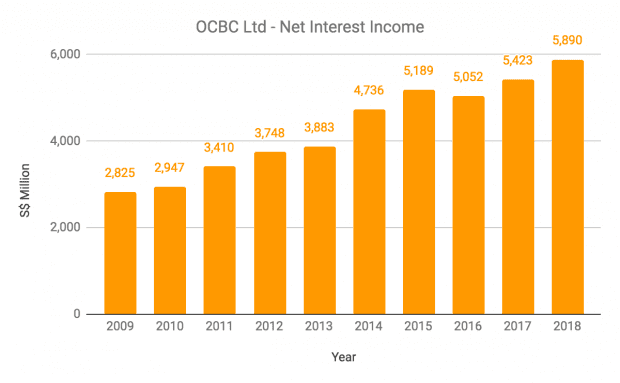
Growth in NII was slower than loans and bills receivables as net interest margin gradually fell during the period, from 2.23% in 2009 to 1.70% in 2018.
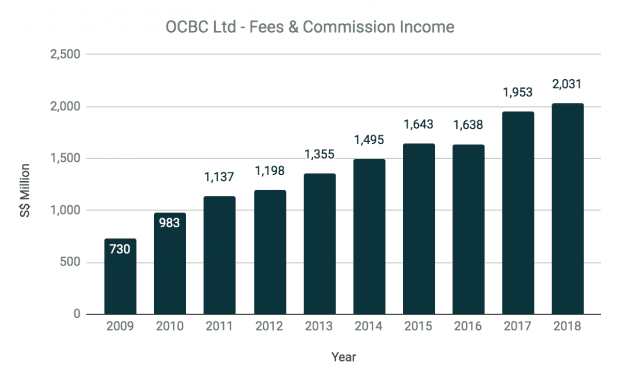
3. Fees and commission income has increased by a CAGR of 12.04% over the last 10 years, from S$730 million in 2009 to S$2.03 billion in 2018. This is primarily due to growth from wealth management services, credit cards, loan-related and trade-related fees and commissions, and remittances.
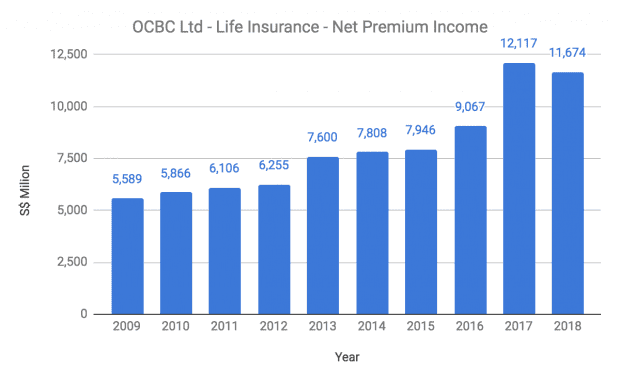
4. OCBC’s life insurance businesses is currently undertaken by its 87.9%-owned subsidiary, Great Eastern Holdings (GE). GE has over four million policyholders and is valued at S$12.3 billion in market capitalisation as at 10 June 2019. GE’s net premium income has increased by a CAGR of 8.53% over the last 10 years, from S$5.6 billion in 2009 to S$11.7 billion in 2018.
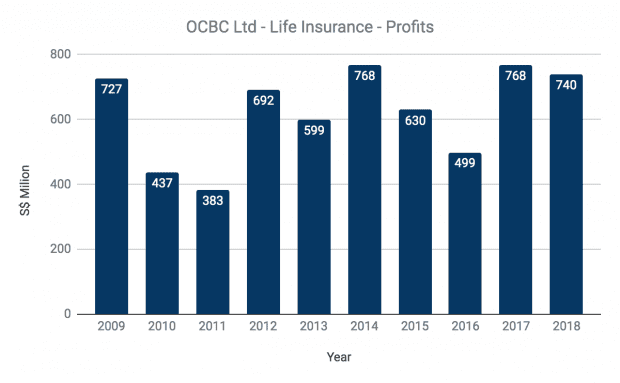
However, earnings have been relatively choppy, averaging at S$624 million annually over the last 10 years.
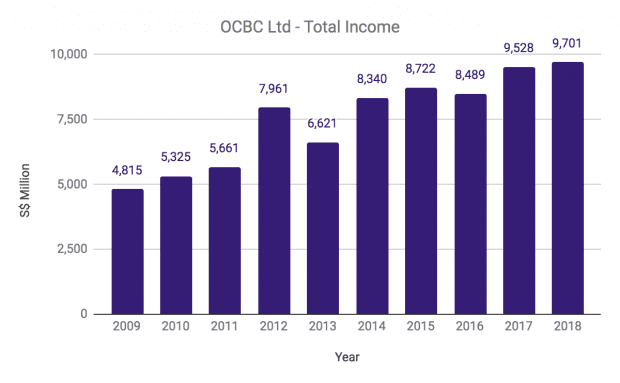
5. OCBC’s total income has increased by a CAGR of 8.09% over the last 10 years, from S$4.8 billion in 2009 to S$9.7 billion in 2018. This is attributed to growth from NII and fees and commissions income during the period.
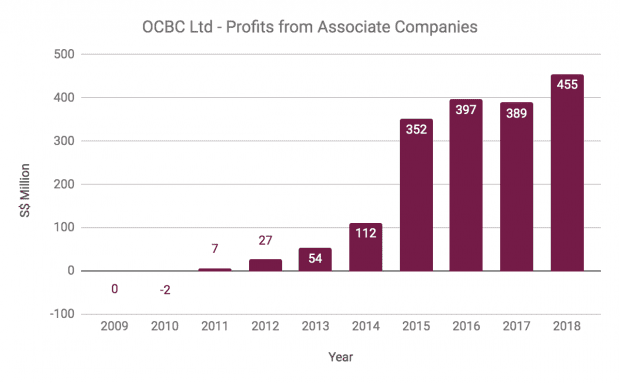
6. Founded in 1997, Ningbo Bank is the first listed city commercial bank in China and worth RMB118.7 billion in market capitalisation as of 10 June 2019. In 2014, OCBC increased its stake in Ningbo Bank from 15.34% to 20.00%. Thus, Ningbo Bank become an associate company of OCBC and now contributes nearly all of OCBC’s profit from associates. In 2018, OCBC recorded a total of S$455.5 million in associate profits, an increase from S$389.2 million in 2017.
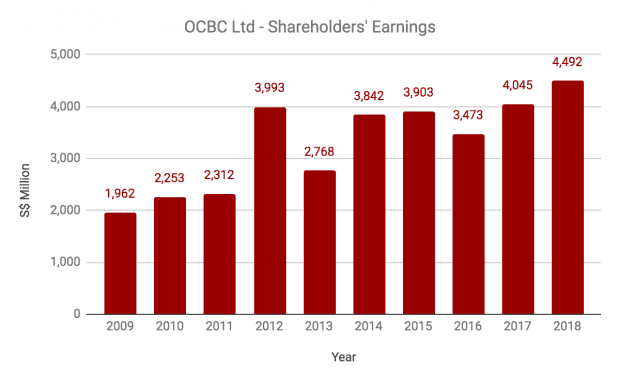
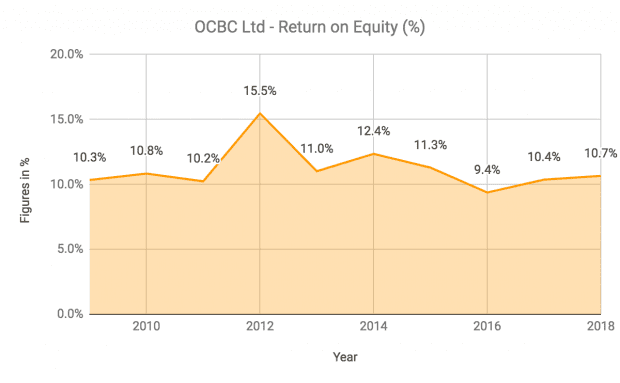
7. OCBC’s shareholders’ earnings have increased by a CAGR of 9.64% over the last 10 years, from S$2.0 billion in 2009 to S$4.5 billion in 2018. This is attributable to consistent growth in total income, profits from Ningbo Bank, and maintaining a steady cost-to-income ratio of 40-50%. OCBC has a 10-year average return on equity of 11.2%.
8. As at 31 December 2018, OCBC has a total capital ratio (TCR) of 16.4%. It is well above the 12.5% minimum set by the Monetary Authority of Singapore. OCBC has an all-currency liquidity coverage ratio of 143% and a net stable funding ratio of 109%, both of which also are above the regulatory minimums. OCBC has total funding of S$375 billion with sources as follows:
| Sources of Funding | Composition (%) |
|---|---|
| Current Accounts & Savings Accounts (CASA) | 37% |
| Fixed Deposit (FD) | 35% |
| Capital & Reserves | 11% |
| Bank Deposits | 2% |
| Debt Issued | 8% |
| Others | 7% |
| Total Funding | 100% |
Source: OCBC FY2018 presentation
Seventy-nine percent of total funding is sourced from customer deposits and only 8% from the issuance of debt. OCBC has Aa1, AA-, and AA- credit ratings by Moody’s, Fitch, and Standard & Poor’s respectively; and has been named as one of the top 50 safest banks in the world.
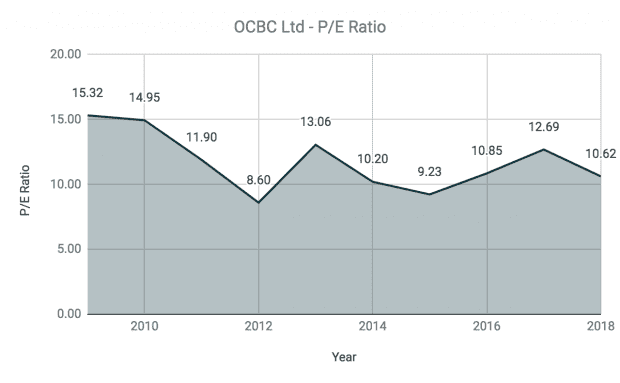
9. P/E ratio: , OCBC reported S$1.06 in earnings per share in 2018. Therefore, based on OCBC’s share price of S$10.73 (as at 10 June 2019), its current P/E ratio is 10.12, which is slightly below its 10-year average of 11.74.
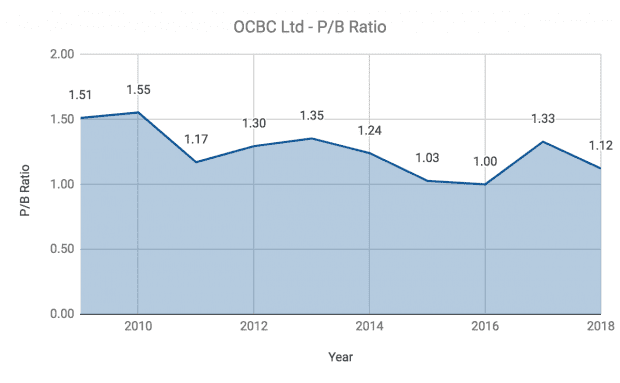
10. P/B ratio: As of 31 March 2019, OCBC had net assets of S$9.97 per share. Thus, OCBC’s current P/B ratio is 1.03, which is below its 10-year average of 1.26.
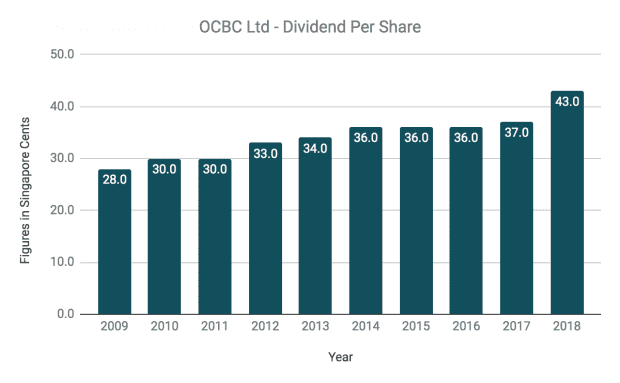
11. Dividend yield: OCBC has steadily increased its dividends per share over the last 10 years, from 28.0 cents in 2009 to 43.0 cents in 2018.
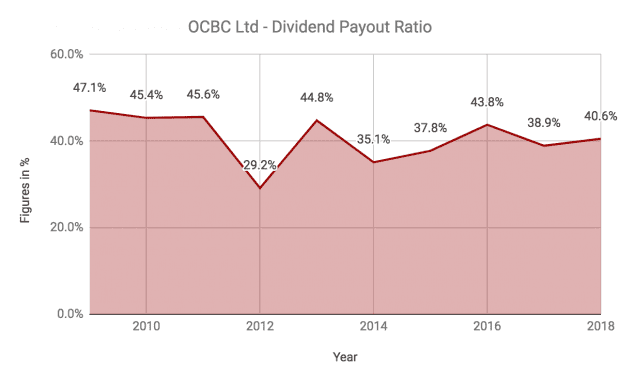
OCBC has also maintained an annual dividend payout ratio of around 40% during the period.
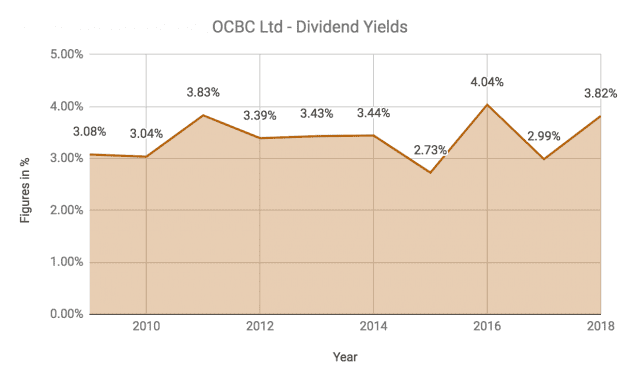
Based on its stock price of S$10.73, OCBC’s current dividend yield is 4.01%, which is above its 10-year average of 3.38%.
The fifth perspective
OCBC has delivered consistent growth in total income, shareholders’ earnings, and dividends over the last 10 years. Right now, the stock is trading below its 10-year P/E and P/B averages, and offering 4% in yield. For investors interested in Singapore banks, OCBC could be be worth a look at right now.