


As you might know, market turmoil in China is currently affecting stock markets everywhere and one of the hardest hit markets right now is just next door to the Middle Kingdom — Hong Kong.
Amid a Chinese economic slowdown, the Hang Seng Index has plunged 35% from its April peak when it crossed below 19,000 last week which caused the index to fall below its net asset value for the first time since 1998 during the Asian financial crisis. In comparison, the S&P 500 currently trades at a price-to-book ratio of around 2.5.
The Hang Seng’s PE ratio is also at one of its lowest points right now. At its close last Friday, the index was trading at just 7.73 times earnings. Now I know that number alone won’t give you the full context, so I did some research and pulled out a chart of the Hang Seng’s historical PE from 1983 to 2015:
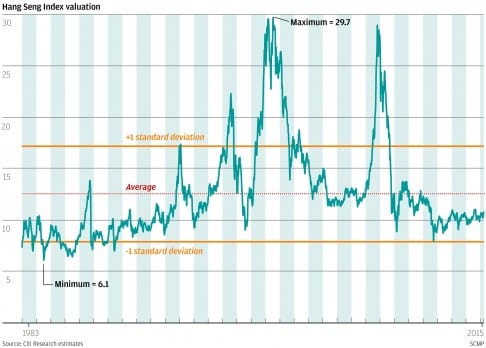
Source: South China Morning Post
The Hang Seng’s PE hit a low of 6.1 in 1984 and high of 29.7 in 2000. It’s historical average is 12.5 times earnings. So it’s quite safe to say that the Hang Seng is trading near its historical low right now — which is great news if you’re a value investor who loves to buy low, sell high.
While Hong Kong stocks overall are cheap right now, picking the right one to invest in requires another layer of research and analysis. If you do your research correctly, you might end up picking a few nice multibaggers. If you mess it up, you might end up with your fair share of value traps.
That’s where the ease of index investing comes in: Rather than analyze and pick individual stocks that may or may not perform in the future, just buy the entire index when it’s cheap and wait for the market to eventually turn around.
Of course, this is not to say that you can’t or shouldn’t do any stock picking (especially if you enjoy the process and you believe you can beat the market) but if you’re the sort that loves passive investing, then investing in an index is the way to go. Another plus point? You also receive dividends when you invest in an index ETF.
The easiest way to invest in an index is through an index ETF. The goal of the ETF is to basically match the performance of the underlying index. So for example, if the S&P 500 rises by 20% in one year, an ETF that tracks the S&P 500 should perform correspondingly as closely as possible. I say as closely as possible because it’s impossible to match an index’s returns perfectly; the difference between the returns of the ETF and the index is called tracking error.
So for the case of the Hang Seng index, here are two index ETFs to watch if Hong Kong is on your investment radar:
Tracker Fund of Hong Kong (HKEx: 2800)
Tracker Fund of Hong Kong (TraHK) was founded by the Hong Kong SAR government in 1999. It is managed by State Street Global Advisors Asia Limited and has HK$65 billion in AUM (as at 22 Jan 2016).
TraHK is listed on the Hong Kong Exchange, is denominated in Hong Kong dollars, and has an average daily volume of 69.8 million shares. It’s expense ratio is considered very low at 0.10% per annum and its tracking error is minimal at 0.0515% (over the last calendar year). Its dividend yield is 4.19%.
Lyxor UCITS ETF Hong Kong (SGX: A9B)
Lyxor UCITS ETF Hong Kong first listed in Singapore in March 2007. It is managed by Lyxor International Asset Management (a subsidiary of Société Générale) and has around US$176.9 million in AUM (as at 21 Jan 2016).
The fund is denominated is US dollars and has an average daily volume of 10,000. Its expense ratio is on the higher side at 0.65% per annum and its anticipated tracking error is 0.15%. Its dividend yield is 2.58%.
If I had to pick between the two, the obvious choice is TraHK. It’s the larger, more established fund with higher trading volume and has a much lower expense ratio and tracking error. TraHK is also a physical ETF while Lyxor UCITS ETF Hong Kong is a synthetic ETF.
A physical ETF tracks an index by actually buying the underlying securities that make up the index. On the other hand, a synthetic ETF aims to track the performance of an index by entering a swap contract with a counterparty. This exposes the investor to counterparty risk if the counterparty cannot honour the swap. In the case of Lyxor, their counterparty is their parent company Société Générale, the third largest bank in France, so the risk should be very minimal.
So why do funds go through the risk and hassle of synthetic replication? In certain cases, it makes sense for an ETF to go synthetic. For example, it wouldn’t make sense for an oil ETF to physically purchase and store barrels of crude oil (which is the reason why there are no physical oil ETFs). Besides that, the advantages of a synthetic ETF is usually its lower costs and smaller tracking error, but in this case, TraHK still beats Lyxor on both counts. The only drawback is that it’s listed on HKEx (a small inconvenience) and since its denominated in HK dollars, you have to account for forex risk — especially since the currency is weakening right now.
The fifth perspective
A final note, it’s important that all investors do your own due diligence as you might derive an entirely different conclusion from the same set of information. China’s slowdown could be worse than expected, the Hang Seng could go lower still and see its PE levels hit 6 or below. No one knows.
In any case, even at this point or even if the index falls lower, you probably shouldn’t be betting your house on it — and only invest your funds based on a sensible portfolio allocation strategy.


Hi Adam,
How does one determine that the NAV of the Hang Seng Index has dropped below its NAV & the P/B ratio of the S&P 500 of around 2.5?
Thank you, JK
Hi JK,
I shared a link above to a Bloomberg article which shows a chart of the Hang Seng’s P/B ratio. The article also states the S&P 500’s p/b ratio: http://www.bloomberg.com/news/articles/2016-01-21/hang-seng-index-sinks-below-net-assets-for-first-time-since-1998-ijnvgtix
You can also view the S&P 500’s historical P/B here: http://www.multpl.com/s-p-500-price-to-book
Good article Adam,
1. Firstly on synthetic vs physical ETFs. I avoid synthetic ETFs like the plague (although I admit to having made money with Lyxor’s products in the past). For me they break one of the golden rules of investing often cited by Warren Buffet: Own what you know and know what you own. With synthetic ETFs it’s really hard to know what you own.
2. Secondly it’s important to consider and monitor the liquidity of the ETFs you invest in. I’ve made mistakes here that have cost me money. (Breaking the first two most important rules of investing: 1. Don’t lose money and 2. Don’t forget the first rule!)
There are physical ETFs out there which look like good value on paper, but have very low liquidity. In fact I admit to owning one! The problem is that some of the low volume funds is that although they look like great value plays, there’s a real risk that the fund manager in question will liquidate the fund leaving you with a loss. For this reason I suggest it’s good advise to avoid ETF’s with total market caps below US$300 million. The reason I pick this number is simple. You have to consider the administrative costs, both to maintain the listing and manage the fund. ETFs have low management expense ratios typically less than 1% of the fund value, and often much less than that (e.g. 0.1% for the TrakHK). For TrakHK the fund’s expenses are about S$12million per annum on a fund valued at about S$12billion, but for say CIMB’s Ethical Asia Pac ETF we’re talking only 1% of a fund worth about S$18 million. When it gets don to a certain level you have to wonder how long it will continue (even if conceptually it seems like a great idea).
Thanks for sharing your knowledge with the readers, Jonathan!
I’m ok with synthetic ones when physical options are not possible (e.g. oil, inverse ETFs, etc), but in general, if I’m looking to buy and hold long term, then I much prefer physical ETFs.
Aren’t ETFs in SGX illiquid? Do you need active buyers and sellers to get in?
It depends which ETFs you’re talking about. There are two STI ETFs and they both seem fairly liquid. I’ve been buying and selling them for about 10 years and never had a problem. However, some of the others are definitely less liquid. Before you jump in and buy, you need to check the market cap of the fund and the average daily turnover.
It really depends on the ETF. For example, the STI ETF (ES3) listed on the SGX is pretty liquid with volume at 966,400. If our own index ETF listed on our own home exchange is illiquid, it’d probably be worse elsewhere!
Hi,
I was wondering if you know where do I get historical PE and/or PB ratios of other indexes such as SGX?
Azrael
iFast has a short compilation here: https://secure.fundsupermart.com/main/articleFiles/Sector_Reviews/SG/en/pdf_Summary.pdf
Thanks Adam!
Hi there.
You mentioned expense ratio of 0.10% per annum and 0.65% per annum respectively. Do you mean that it is being charge annually?
cheers
Max
Hi Max,
Yes, the expense ratios are charged annually.
Cheers,
Adam
Do you know where can I find historical PE ratio for companies listed on KLSE?
Hi WH,
We don’t know of any free sources; we subscribe to a financial provider for the historical data.
But if you’re looking for historical P/E data for the overall Malaysian market, you can view it here:
https://www.ceicdata.com/en/indicator/malaysia/pe-ratio