


Apple Inc. (Nasdaq: AAPL) is probably the most well-known company on the face of the earth and is also the largest public company in the world by market cap. Apple hit a 52-week high yesterday, 17 Jan 2017, when its share price touched $120. It’s market cap now stands at over $629 billion.
Have a look at its 1-year chart:
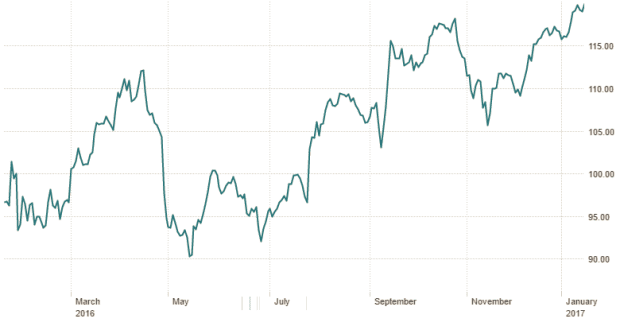 Chart: Financial Times
The question now is: Can Apple break its 52-week high and possibly rise even further? Or will the stock meet with strong resistance and come tumbling down like in October last year when the stock price last reached these levels?
The 52-week high is simply the highest price a stock has traded over the past year. In itself, the 52-week high has NO intrinsic numerical value. A stock trading at its 52-week high doesn’t necessarily mean it’s expensive. In fact, a stock could be trading at its 52-week high and rise even further in the months (or years) to come. Fundamentally, we have to remember that price and the intrinsic value of a stock are two separate things.
However, the 52-week high can have an impact on a psychological level. Some investors will be reluctant to enter when prices are at the highest in a year. Similarly, others will be tempted to exit and take profit at this level. Because of this, the 52-week high can be a significant resistance level at times.
In the case of Apple, not only is the $120 price level its current 52-week high, it has also been a significant resistance level for the past three years:
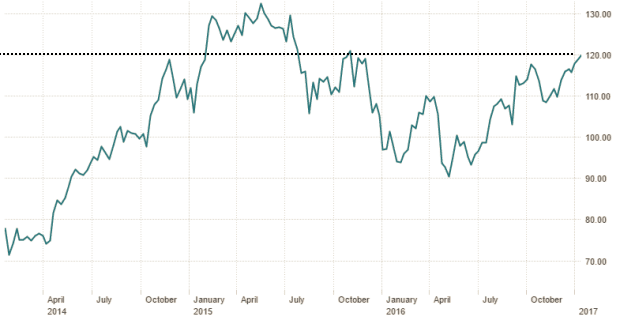 Chart: Financial Times
As you can see from the chart above, Apple hit this resistance in Nov 2014, Nov 2015 and Oct 2016 only for prices to come back down. The only time Apple ever crossed this resistance level was in Feb 2015 and went on to make an all-time high of $134.54 on 28 April 2015.
To dig a little deeper, I decided to have a look at Apple’s trailing twelve months P/E ratio over the last five years to see if I could find a significant P/E trend. I then superimposed Apple’s P/E ratio on its five-year price chart whenever it hit a peak or trough:
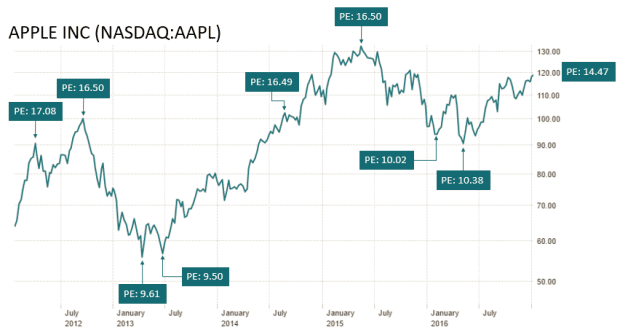
As you can see from the chart above, Apple seems to trade between the ranges of 9-16 times earnings over the last five years. Whenever Apple hit a P/E of 16+, it would peak and come back down. There was one exception when prices continued rising (and subsequently hit the all-time high) even though Apple hit a P/E of 16.49 in Aug 2014.
What was really clear though was that Apple seems to bottom out at a P/E of 9-10. It has never gone below that valuation in the past five years.
So back to the question: Will Apple be able to break its 52-week high, or not?
The thing about the stock market is that no one can predict with 100% accuracy where prices will go; we can only work with our approximations and evaluations.
For example, based on the five-year historical data, if Apple’s P/E ratio is above 16 and the stock is trading at a 52-week high that has also proven to be a significant resistance level so far, I can make the case that it’s probably a good time to exit the stock.
Right now, Apple’s P/E is 14.47. It’s close to P/E 16 and I will most likely trim a portion of my Apple holdings at $120 even though analysts are expecting a record first quarter when Apple announces its results Jan 31.
On the other hand, reports have also emerged that the iPhone 7 isn’t selling as well as Apple hoped. And some reviews for Apple’s new MacBook Pro have been lacklustre. Another negative is that many top-level Apple insiders have been aggressively selling their shares over the past 12 months:
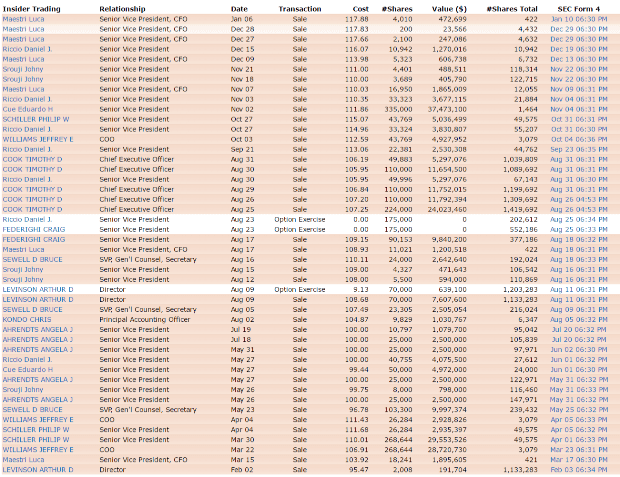 Source: Finviz
Whichever the case, I’m happy to cash in on a good portion of my Apple stock (exiting at this point now would give me a return of 26.94%) and hold the rest of my position to see how Apple’s 1Q 2017 pans out.